Posted on

Stock Market Forecast #683Z

Stock market forecast #683Z charts by artist Stephen F. Condren.

Stock market forecast #683Z or stock market architecture charts, pencil rendering by artist Stephen F. Condren, of Condren Galleries, with prints, and scans predicting future stock market moves. Prints & Scans Of This Drawing #683Z ~ Order Here.

Image of a chain link with text.
Please link to me!

Posted on Google, Facebook, Twitter, Linked-in, and Tumblr.

Stock Market Forecast Video

Stock Market Analysis

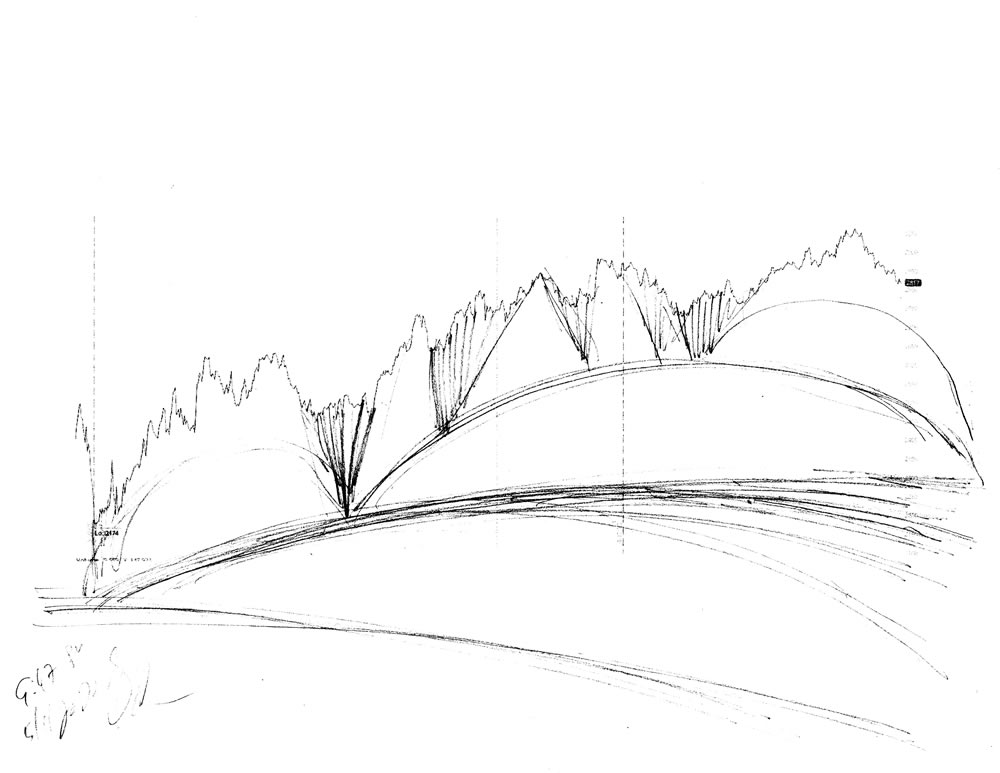
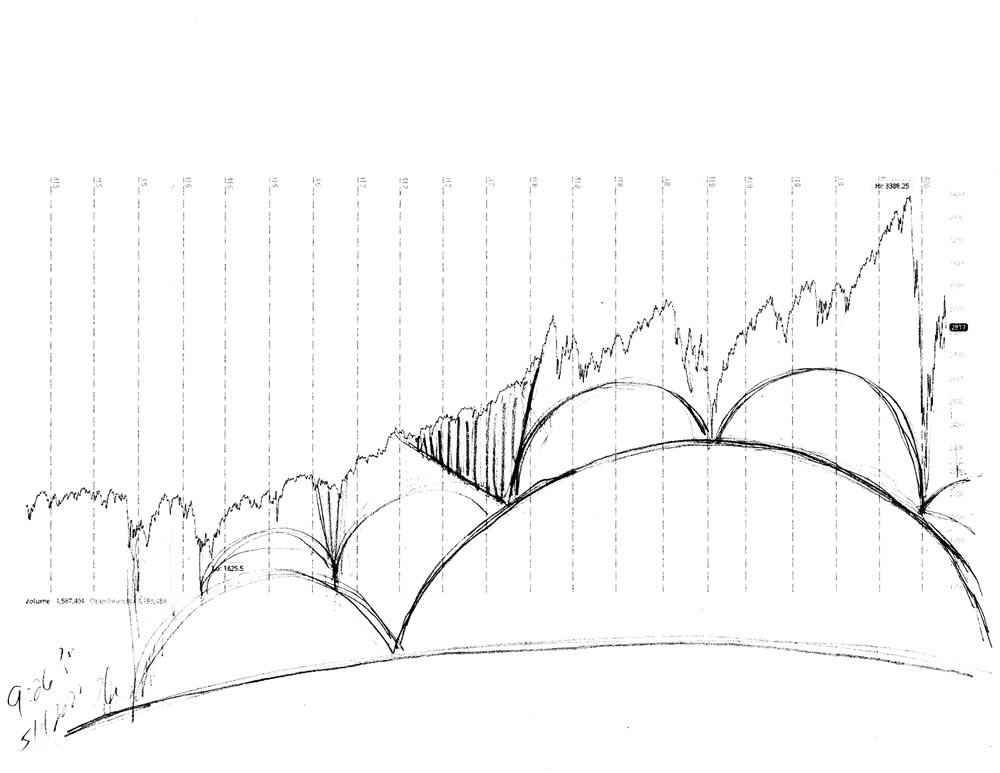
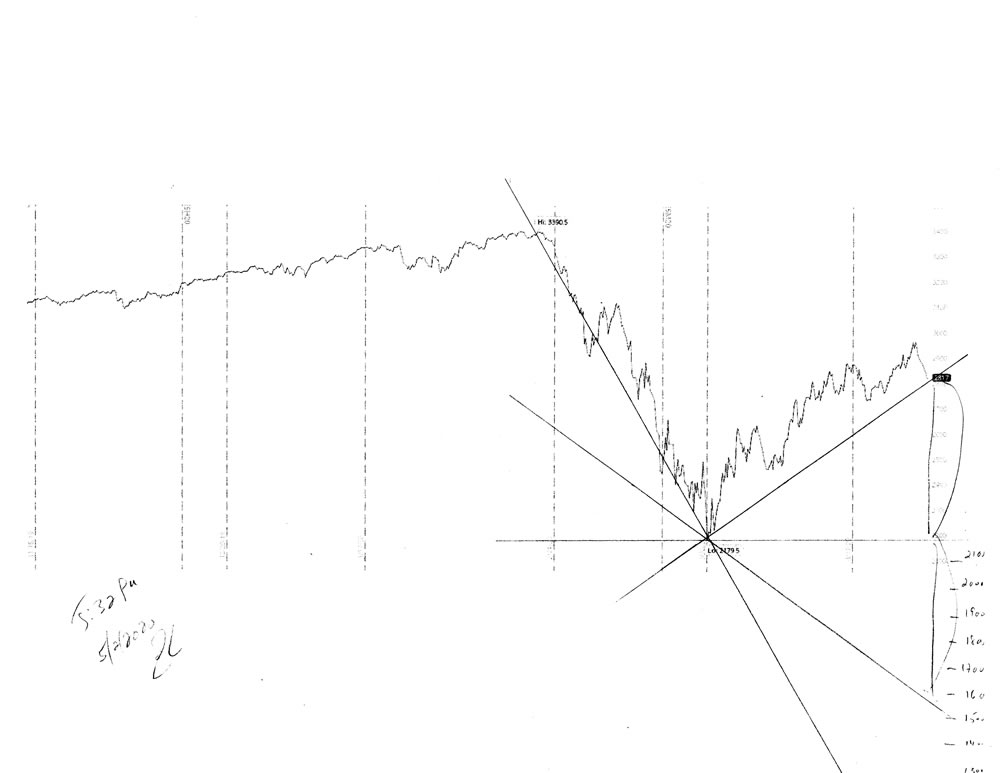
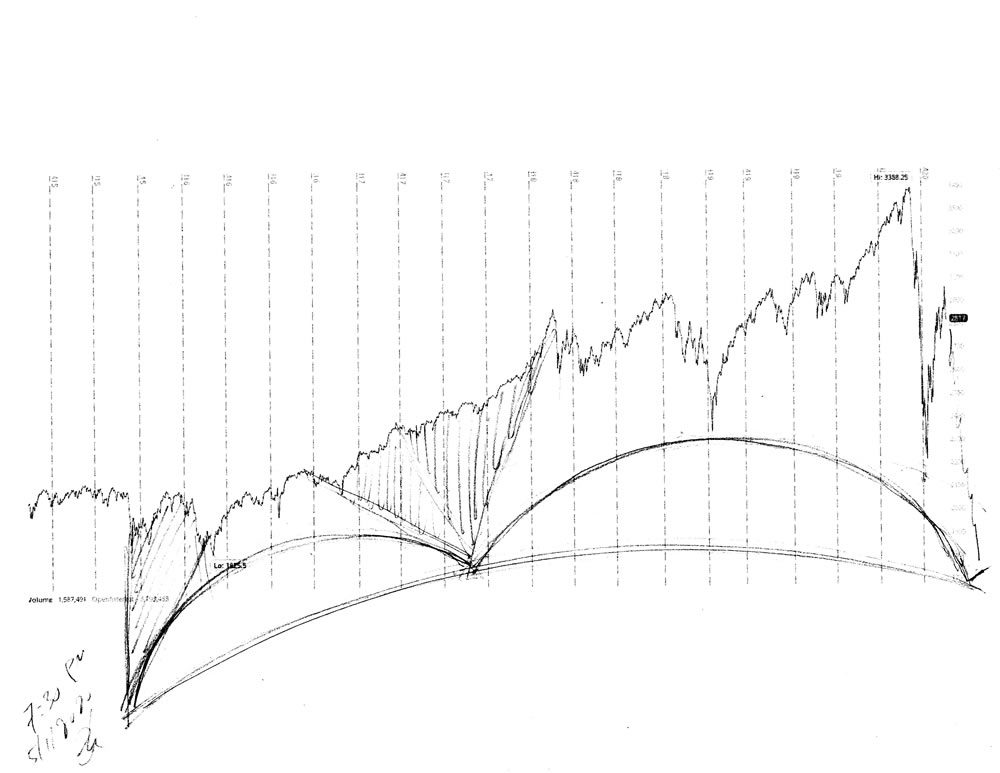
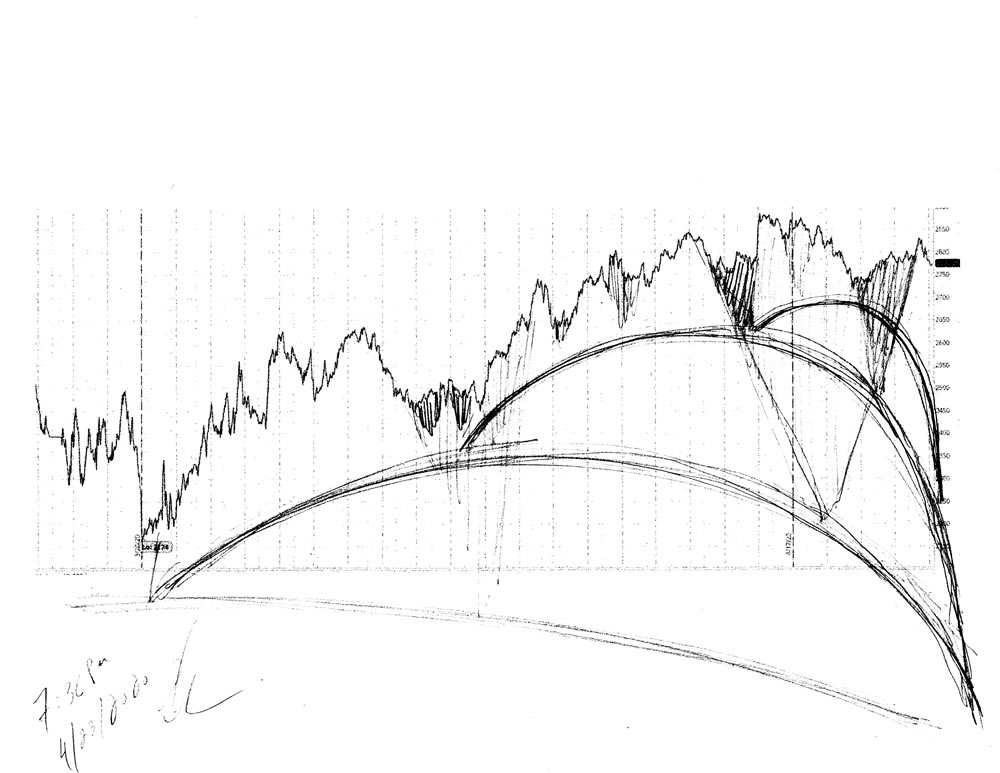
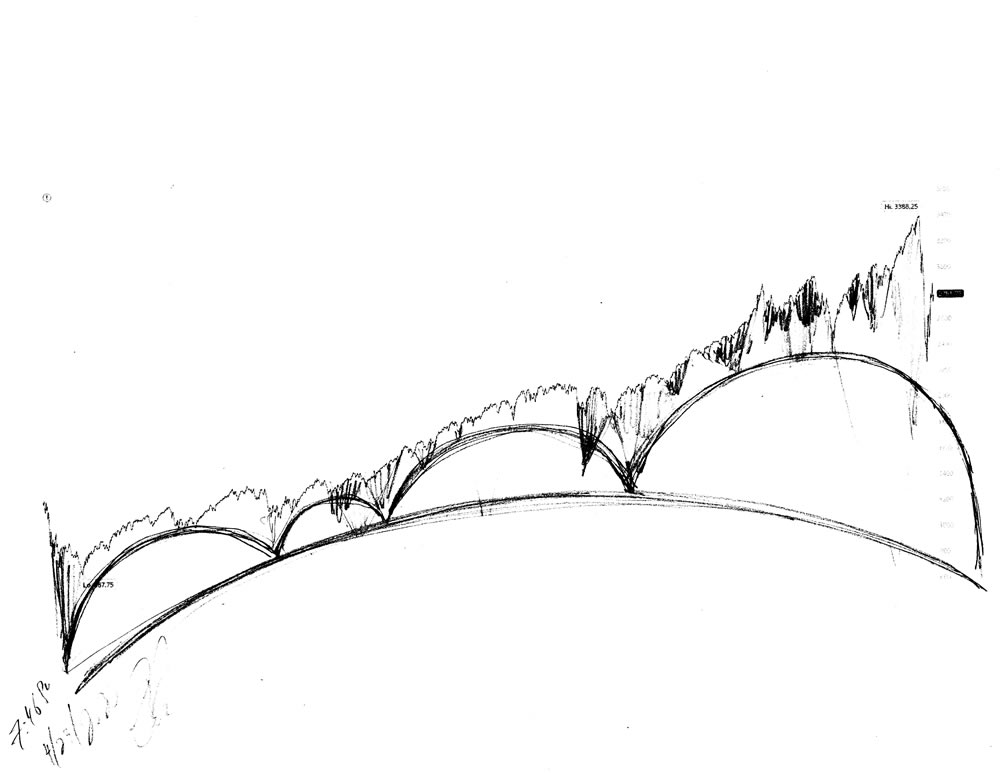
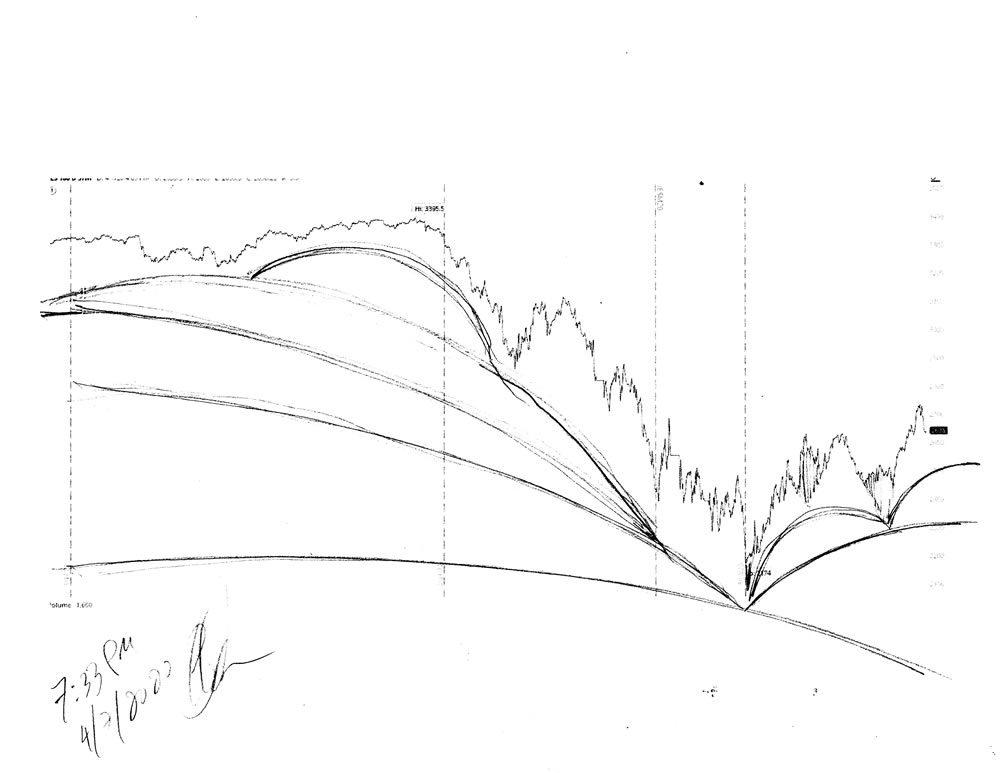
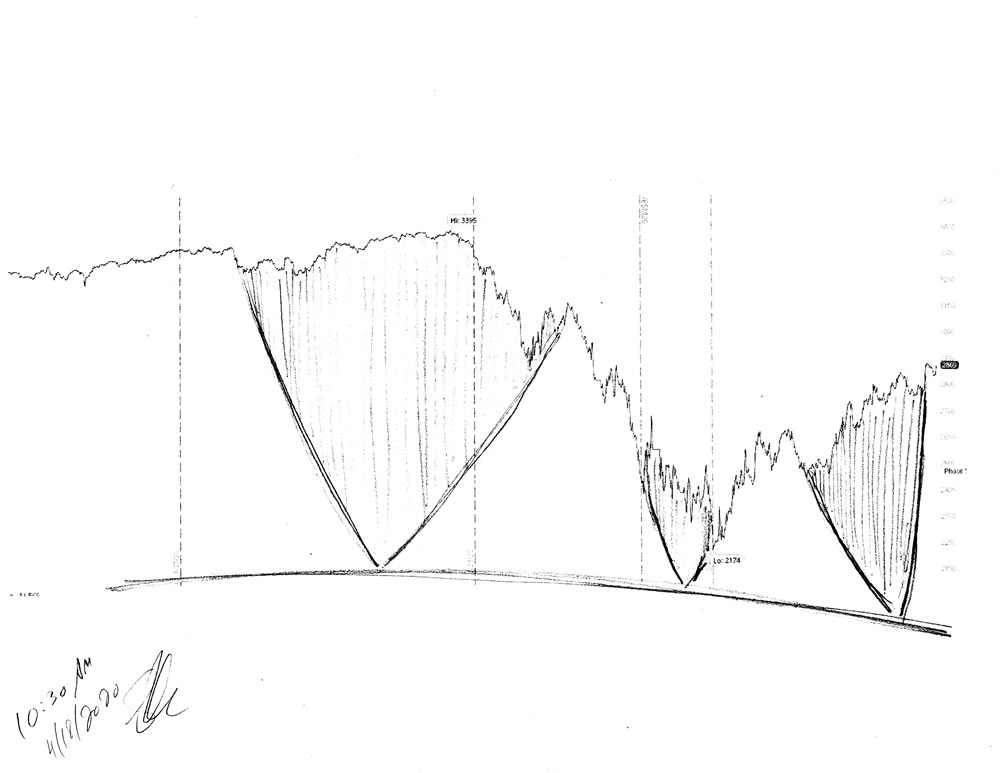
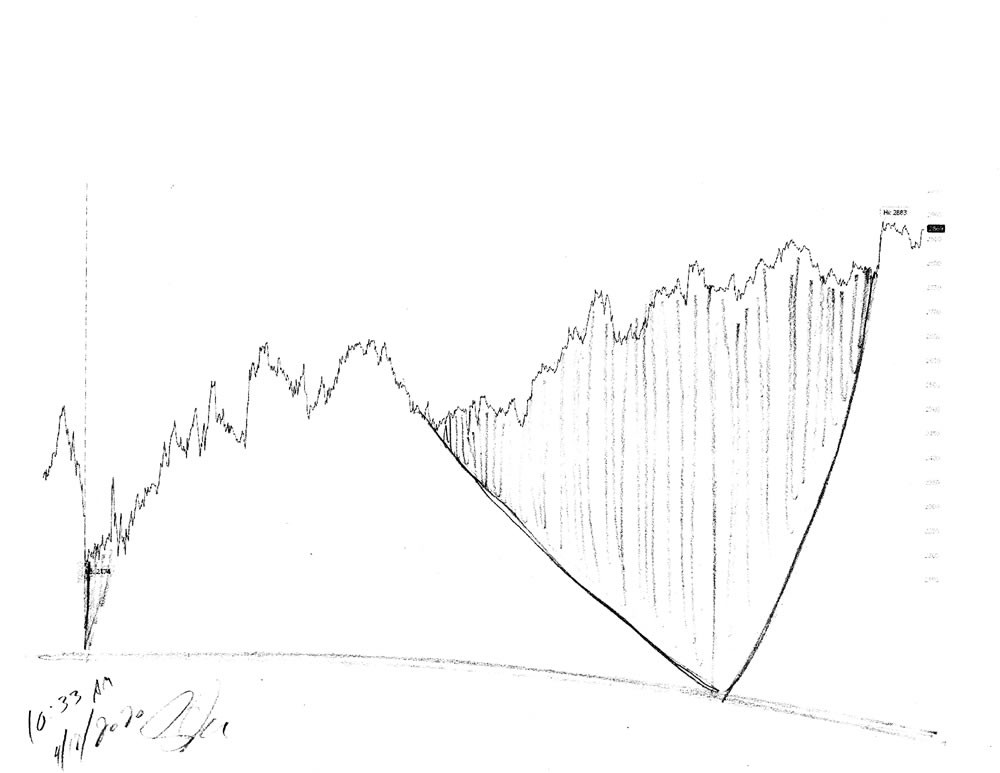
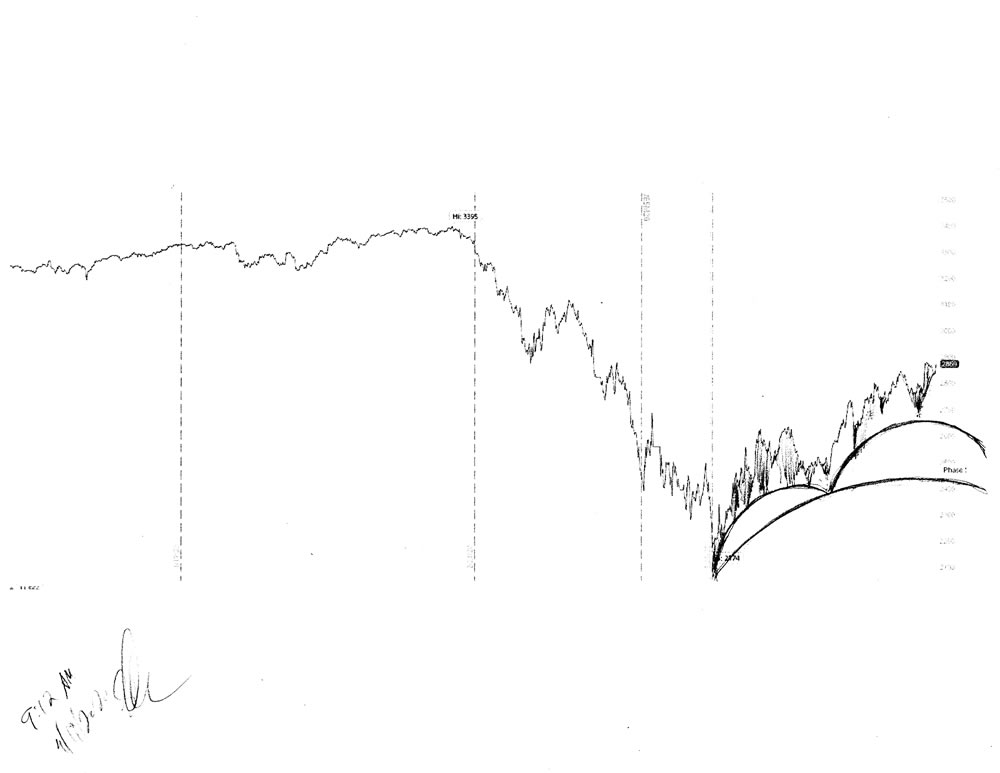
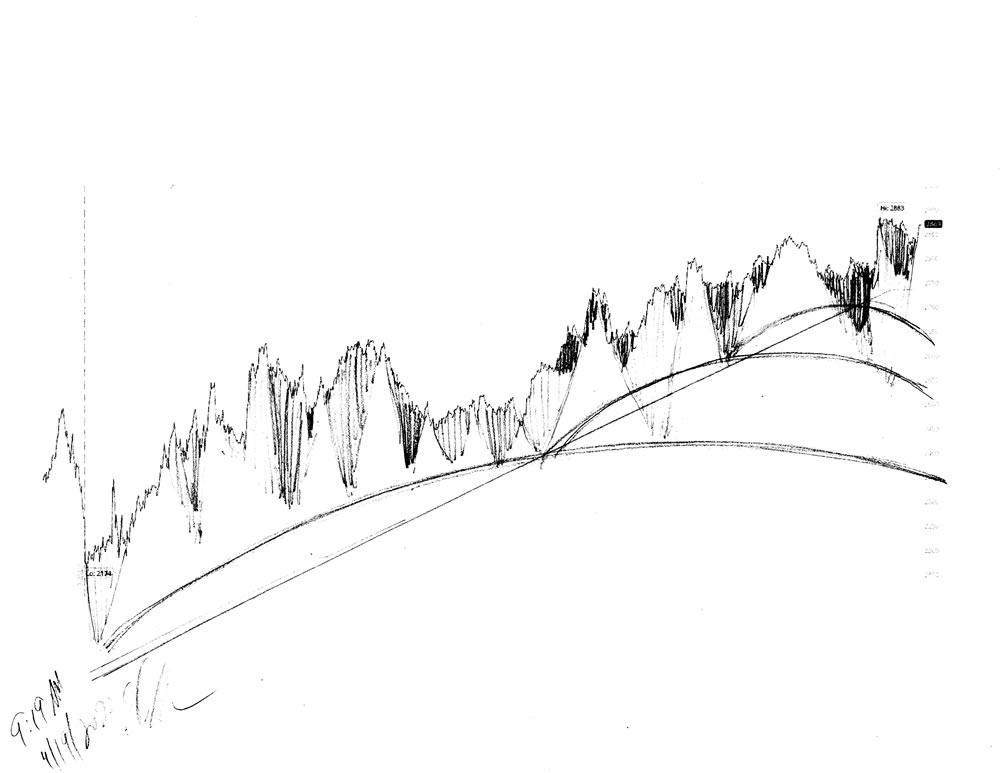
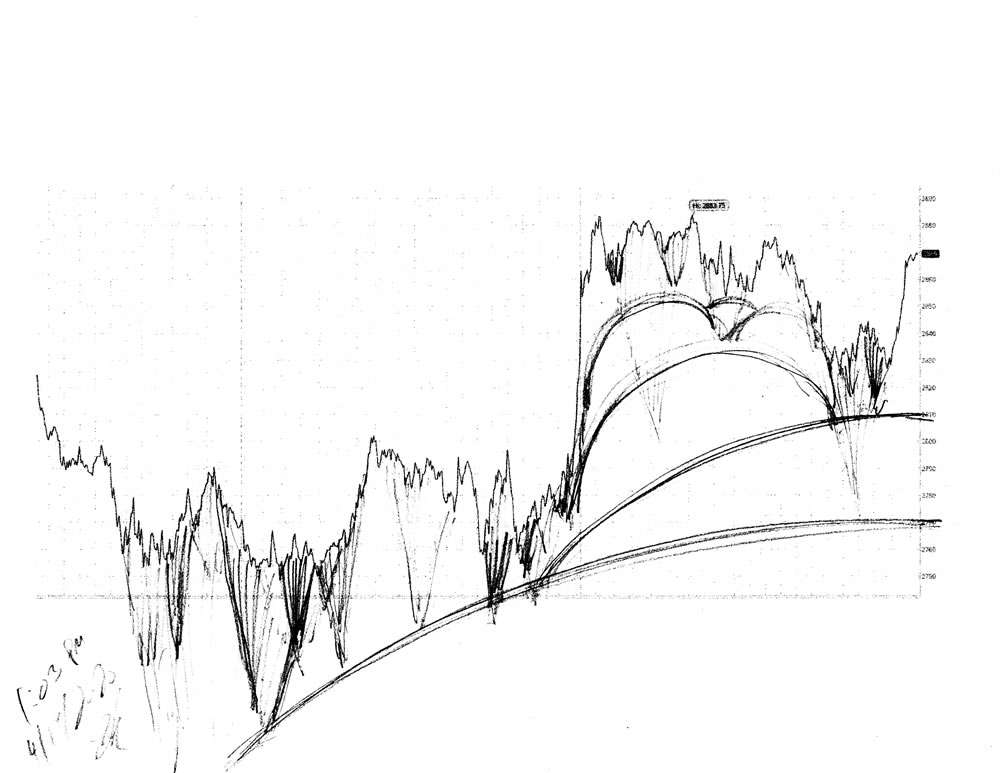
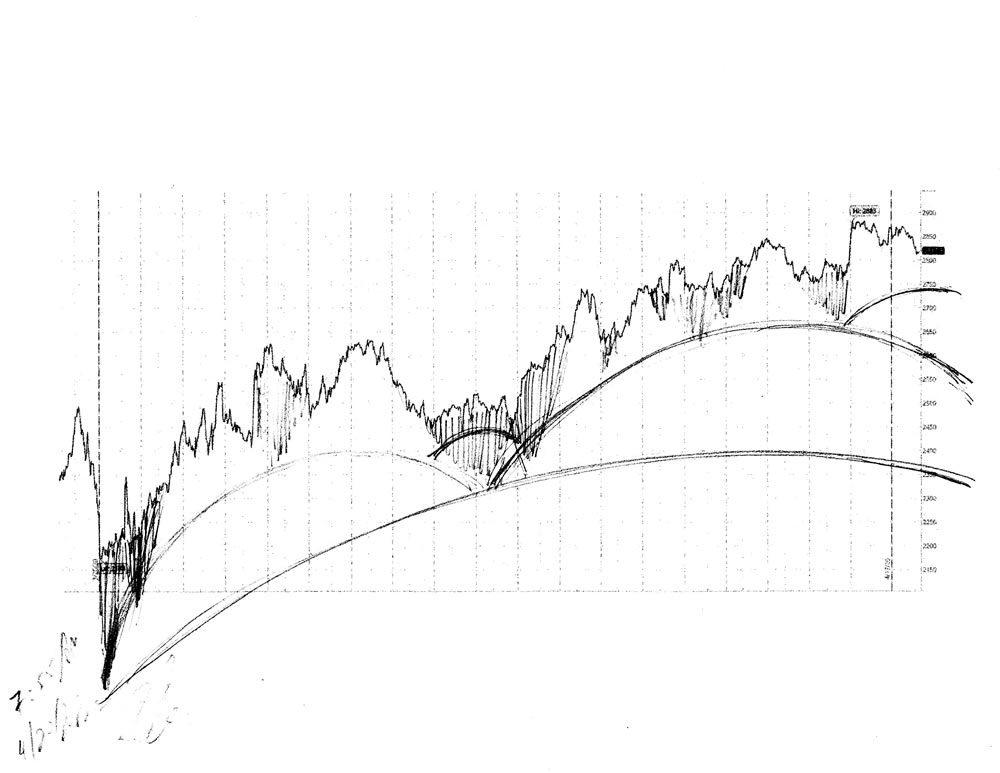
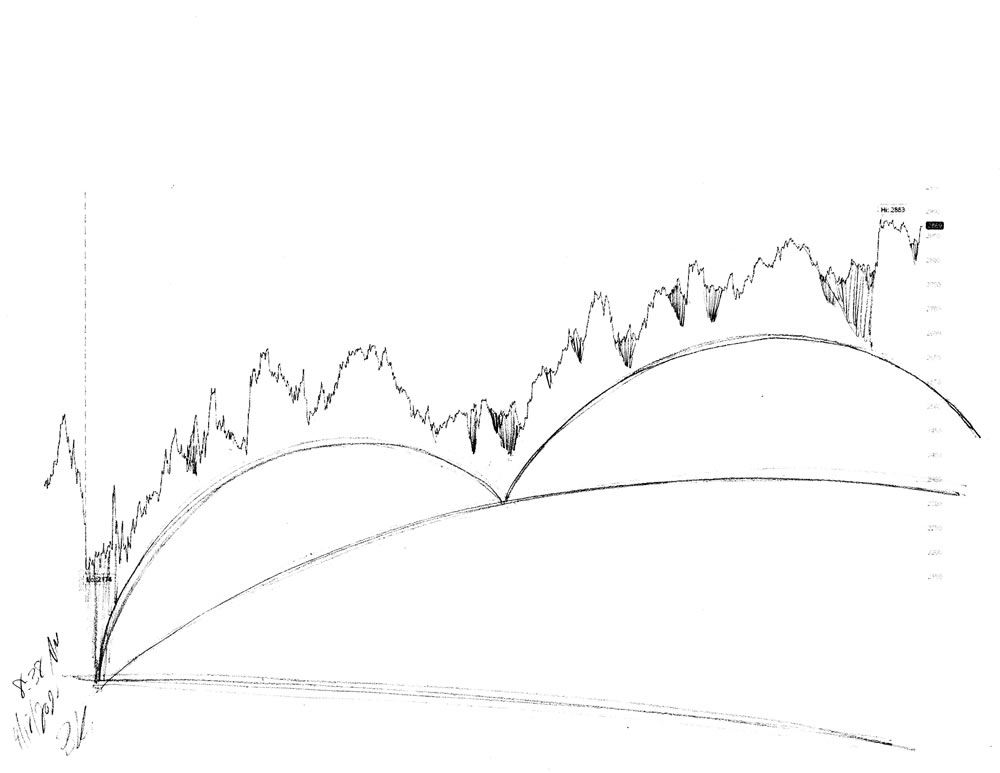
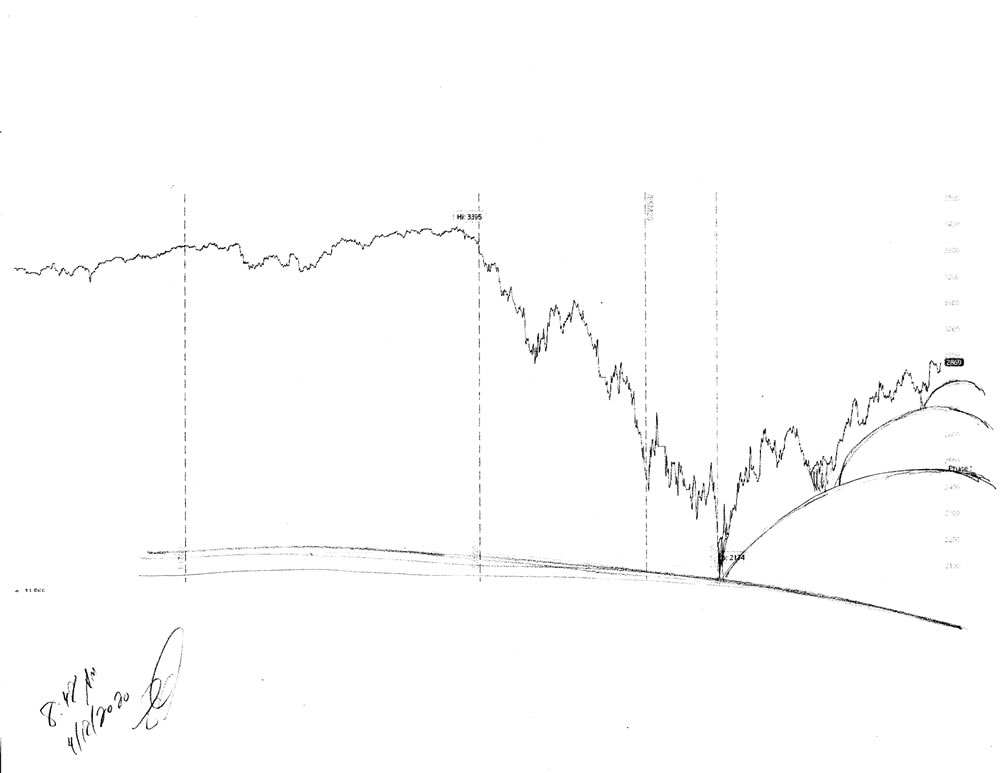
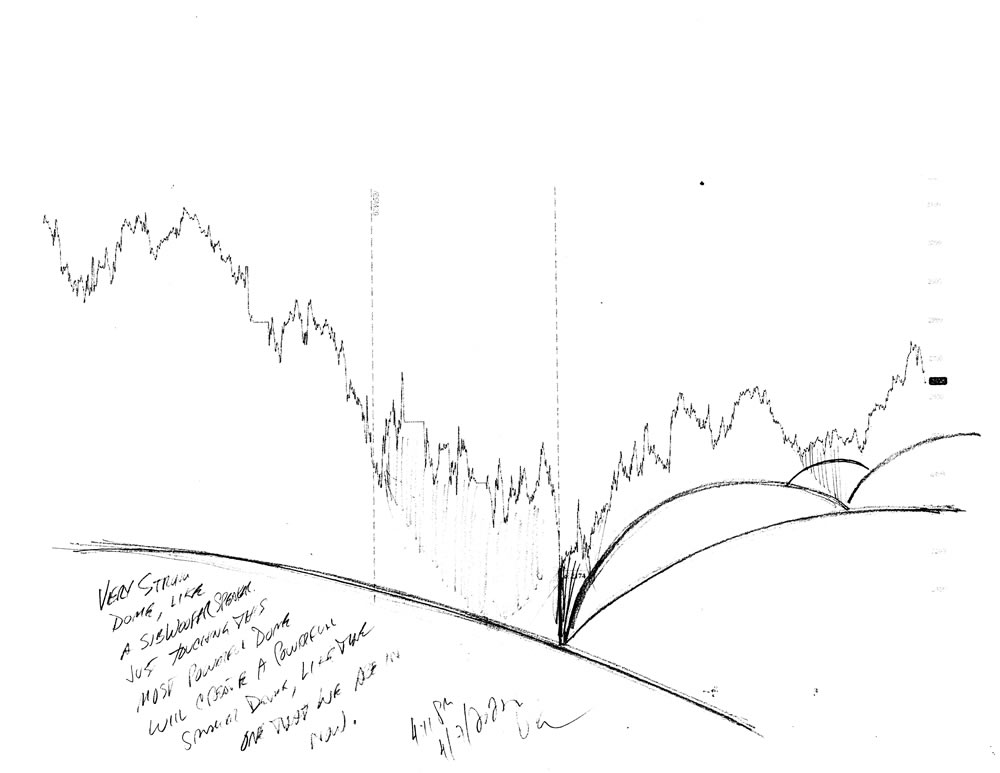
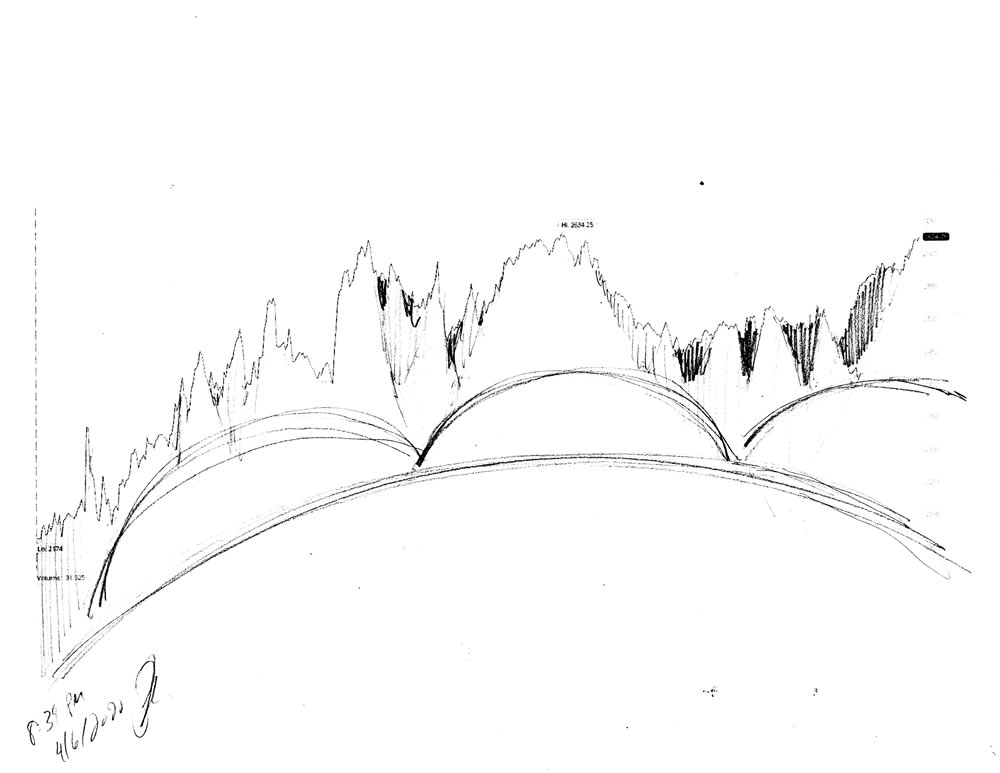
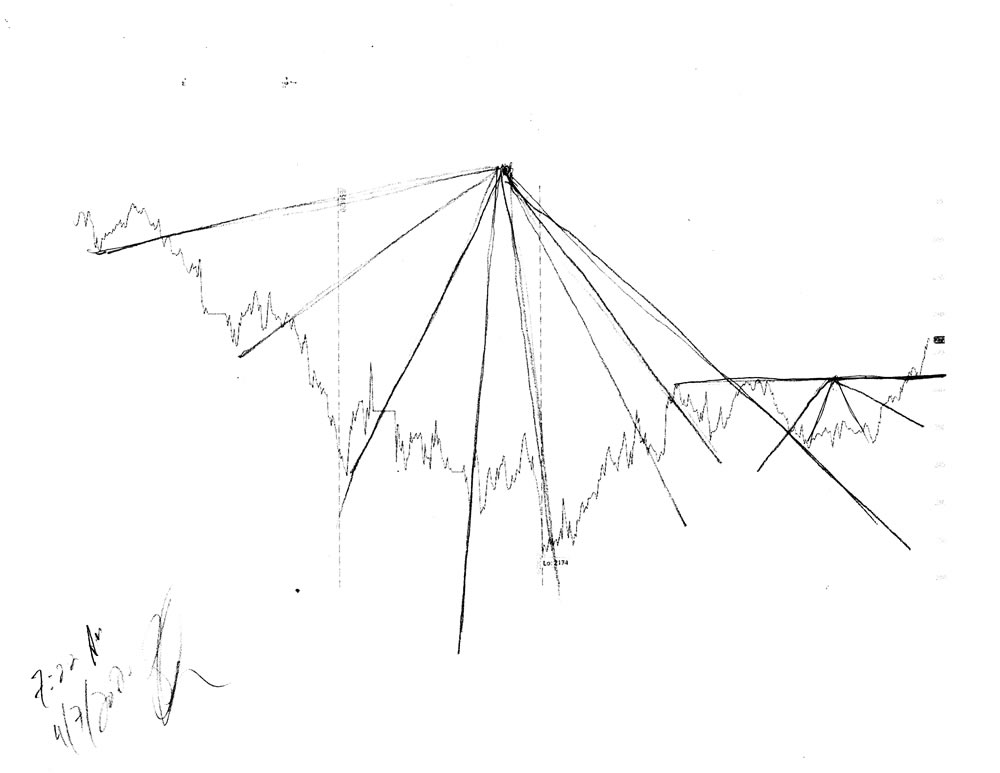
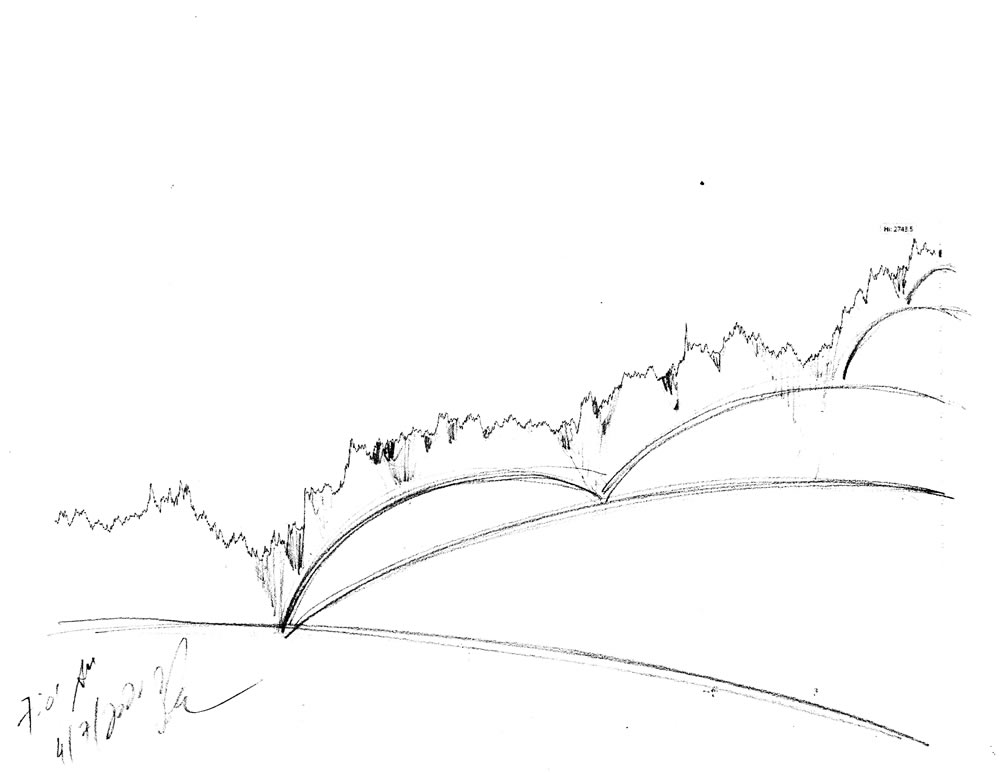
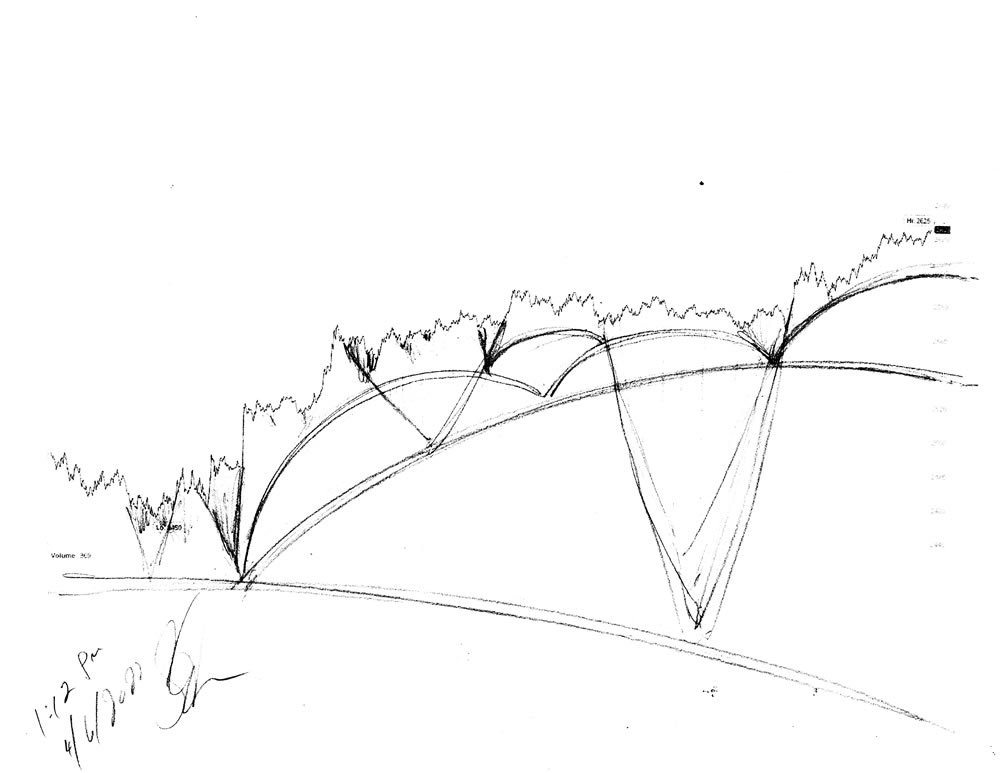
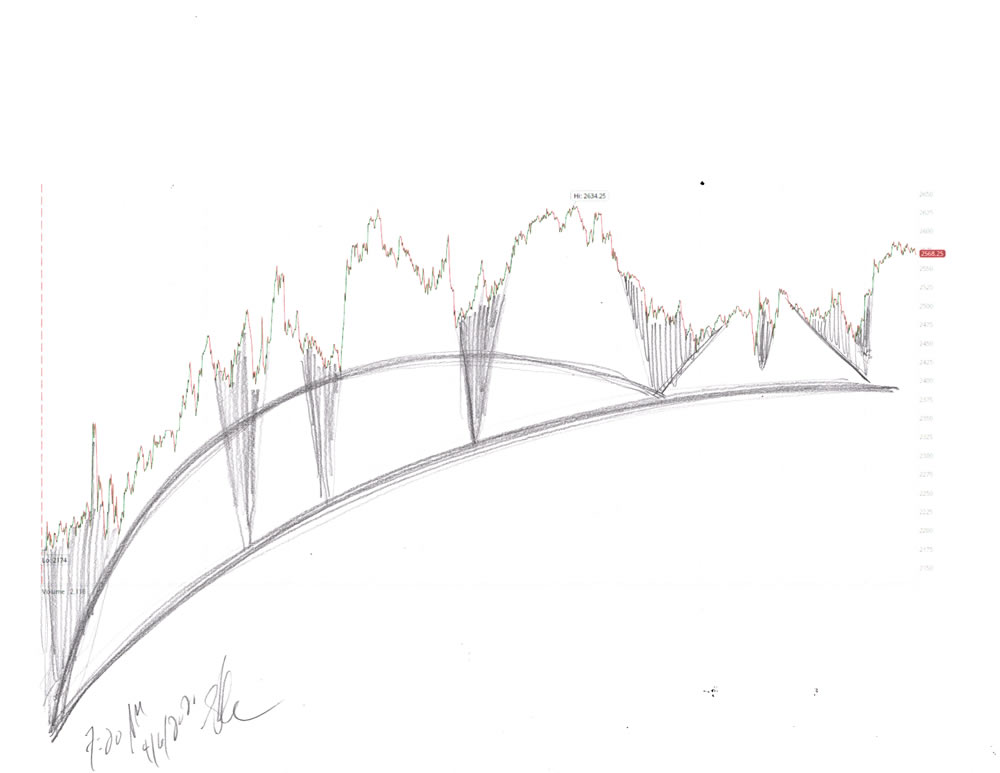
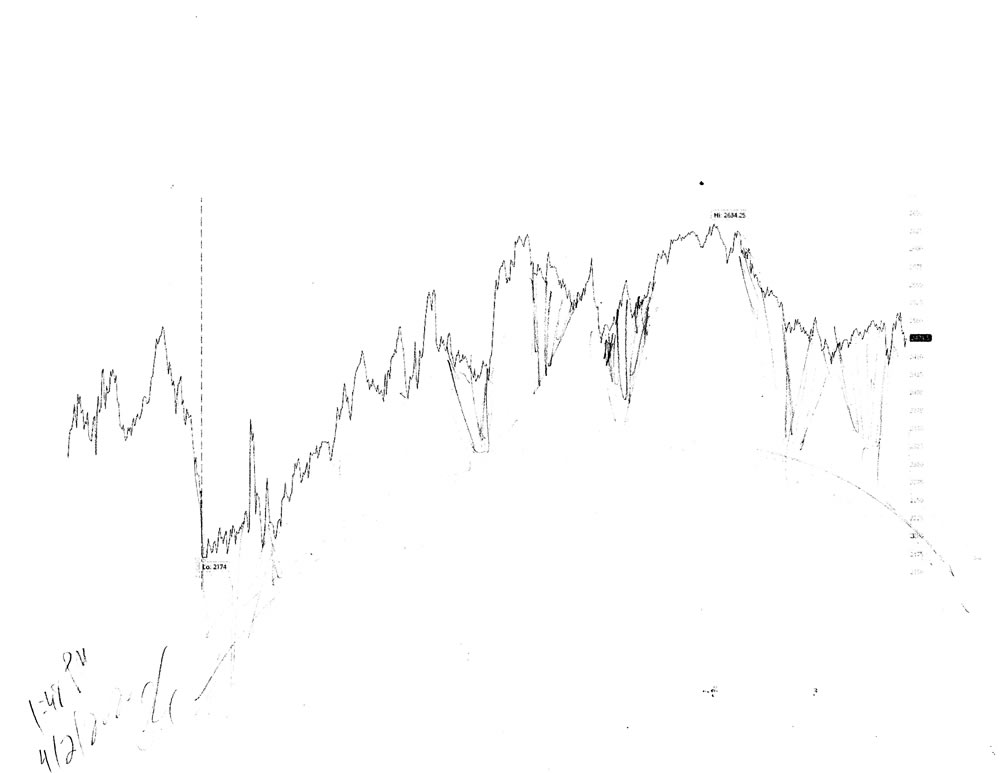
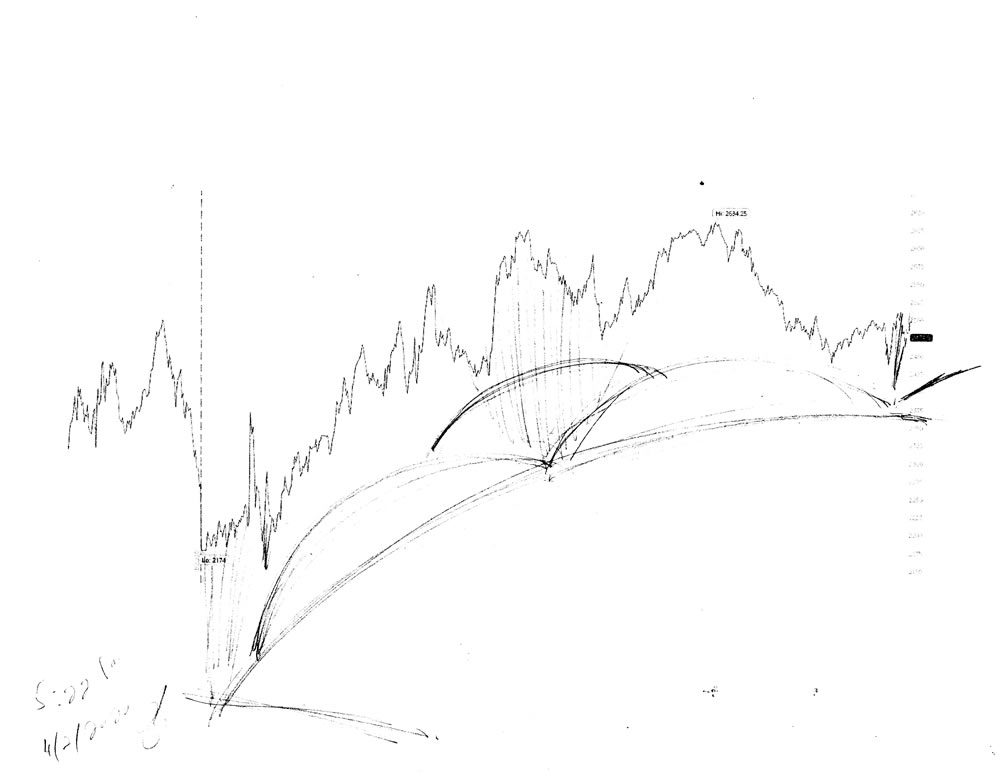
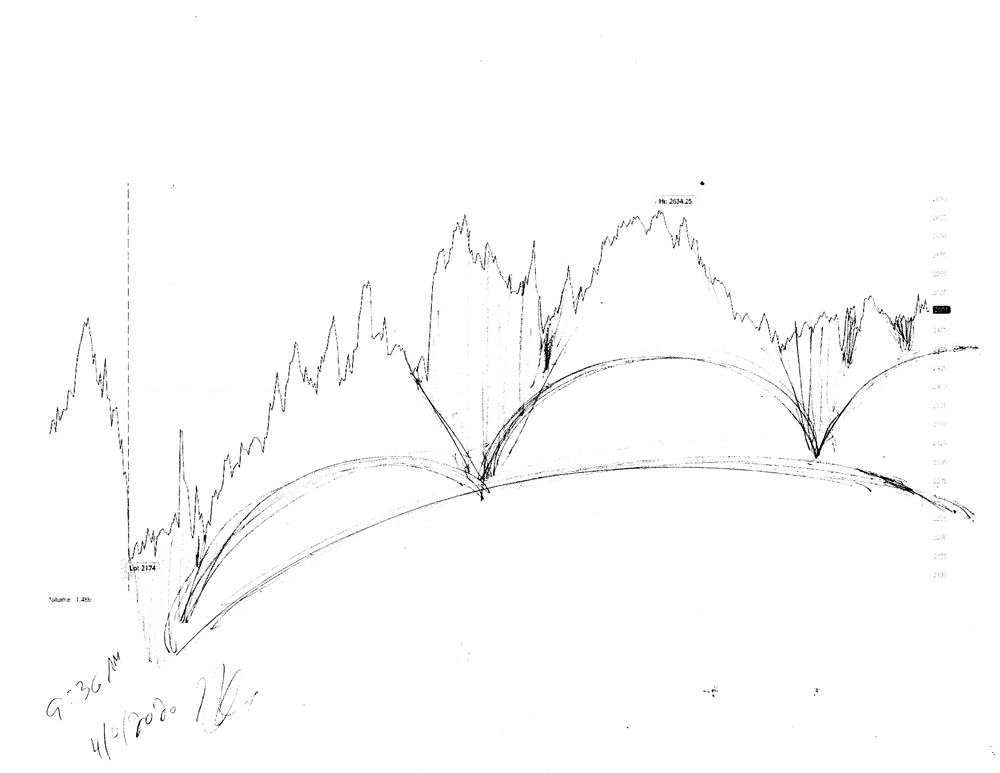
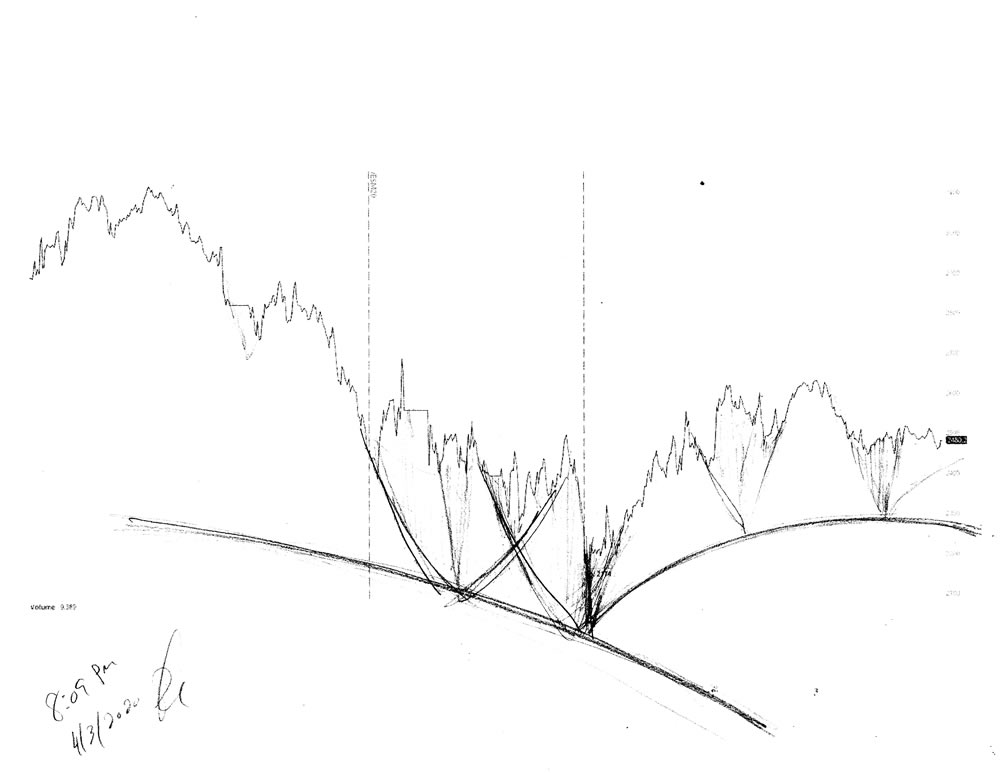
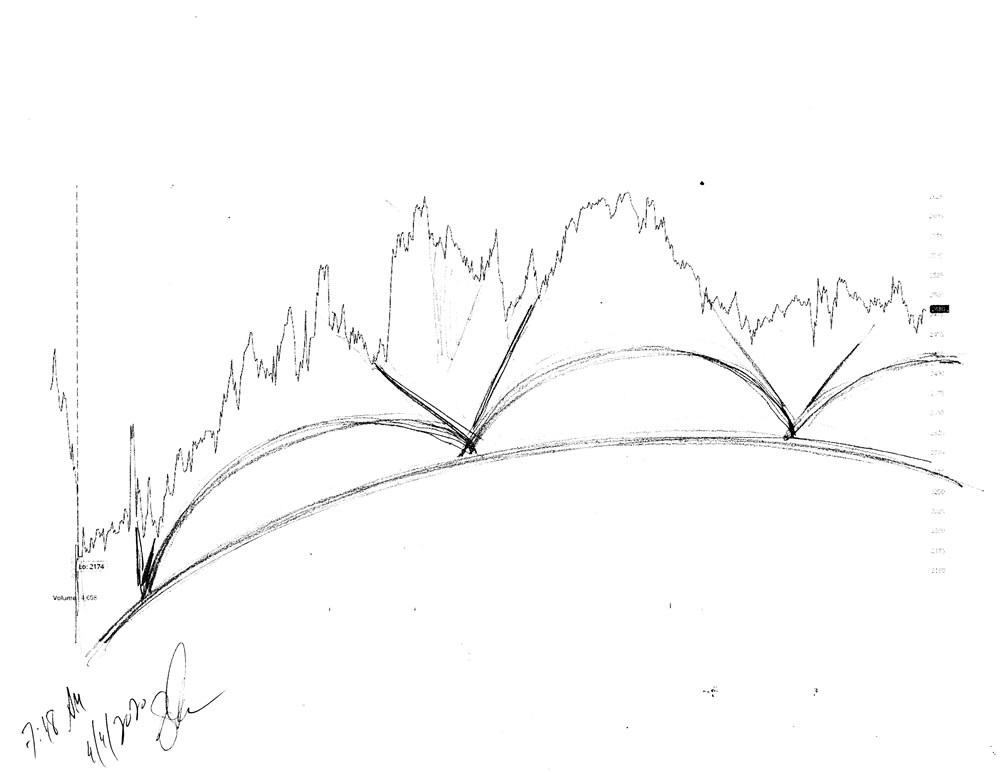
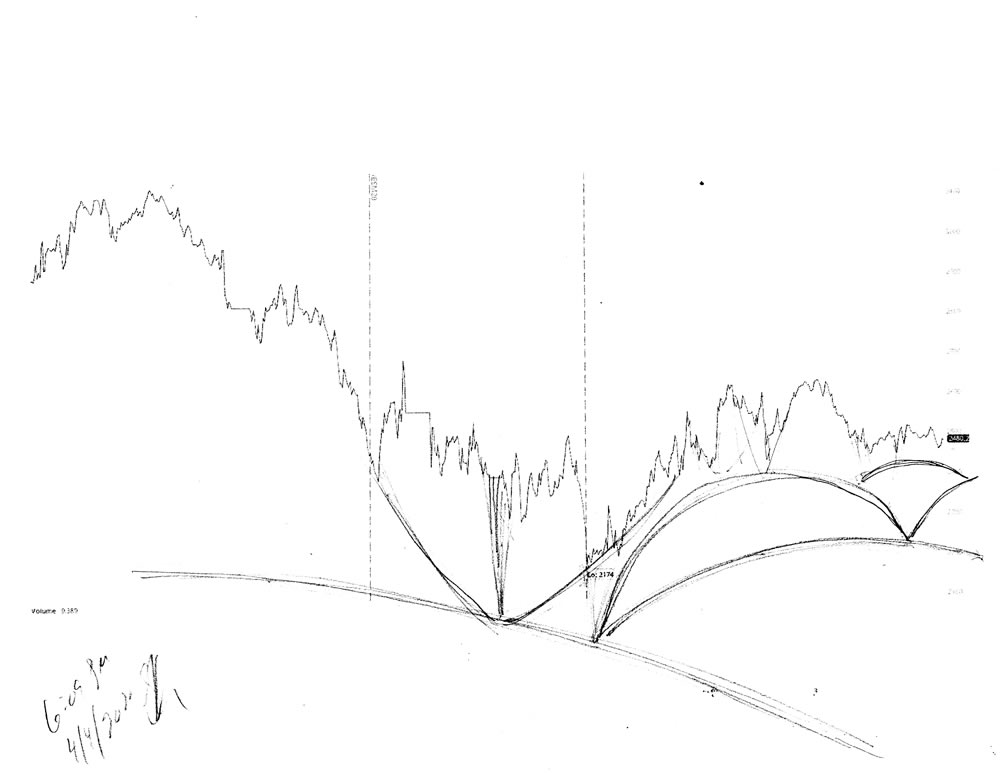
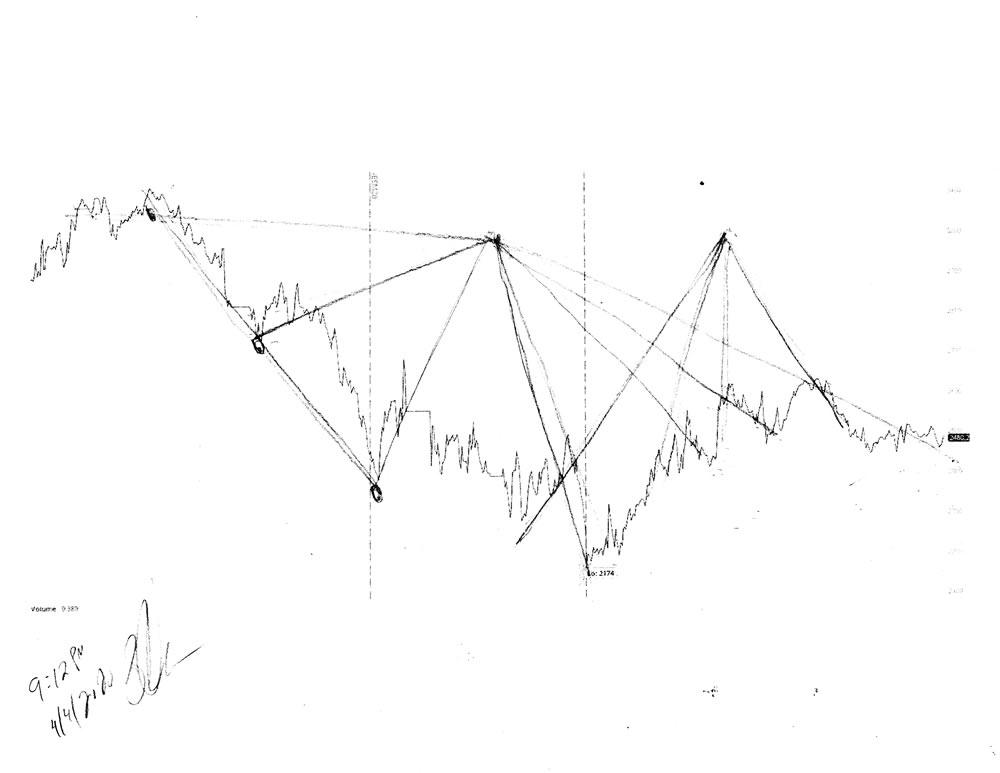
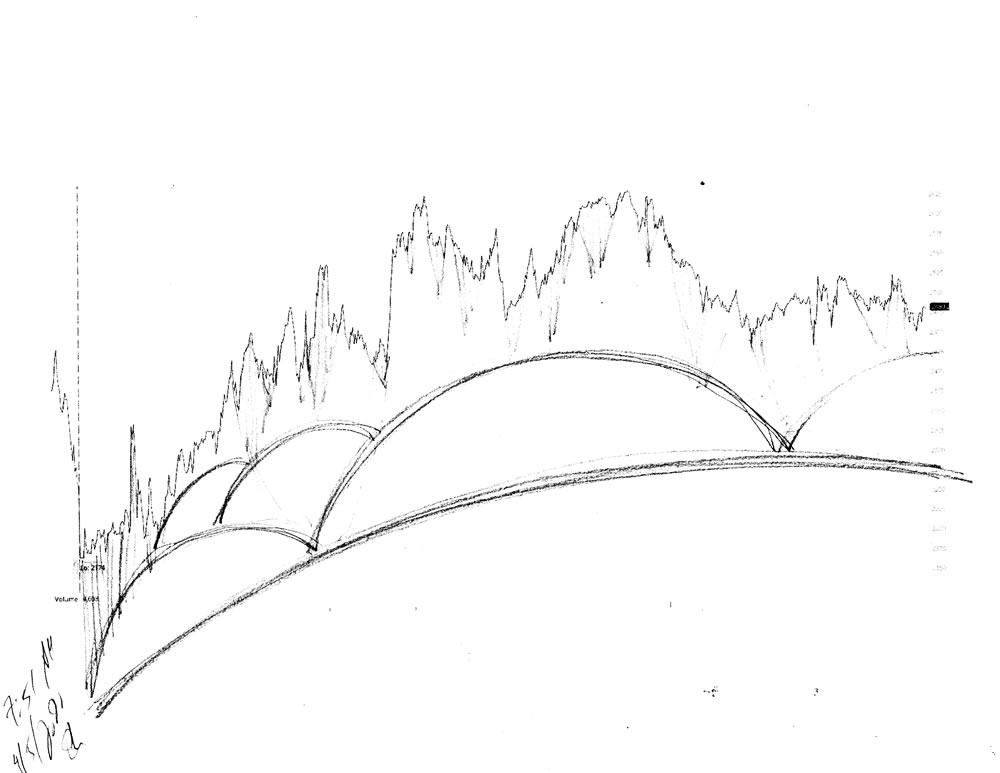
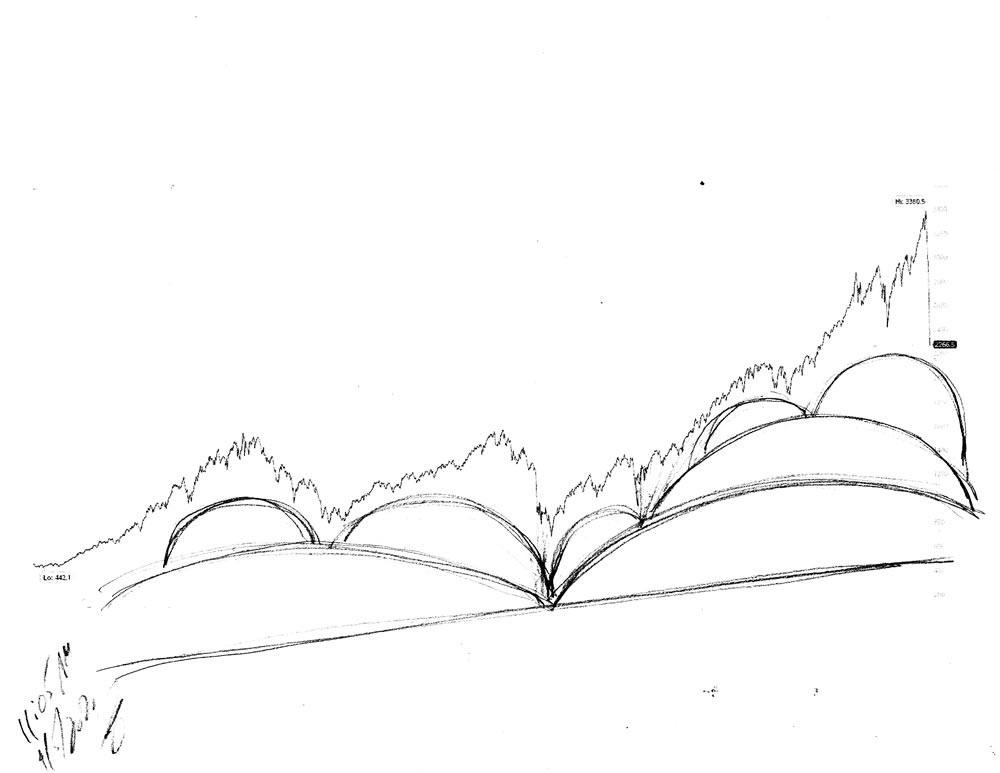
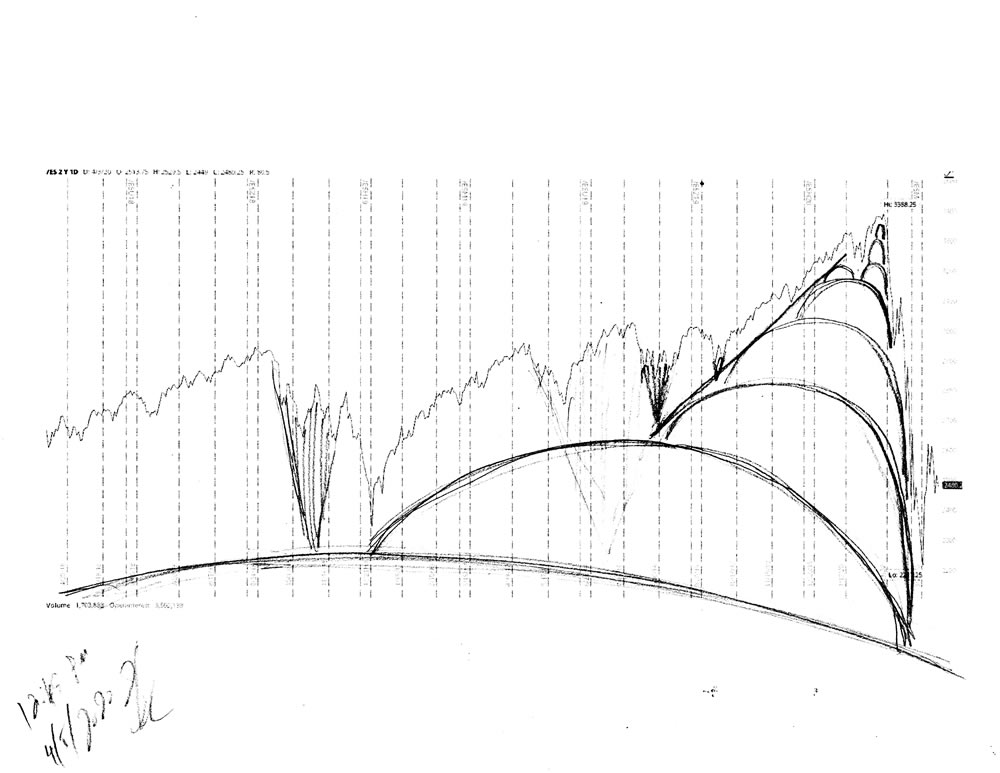
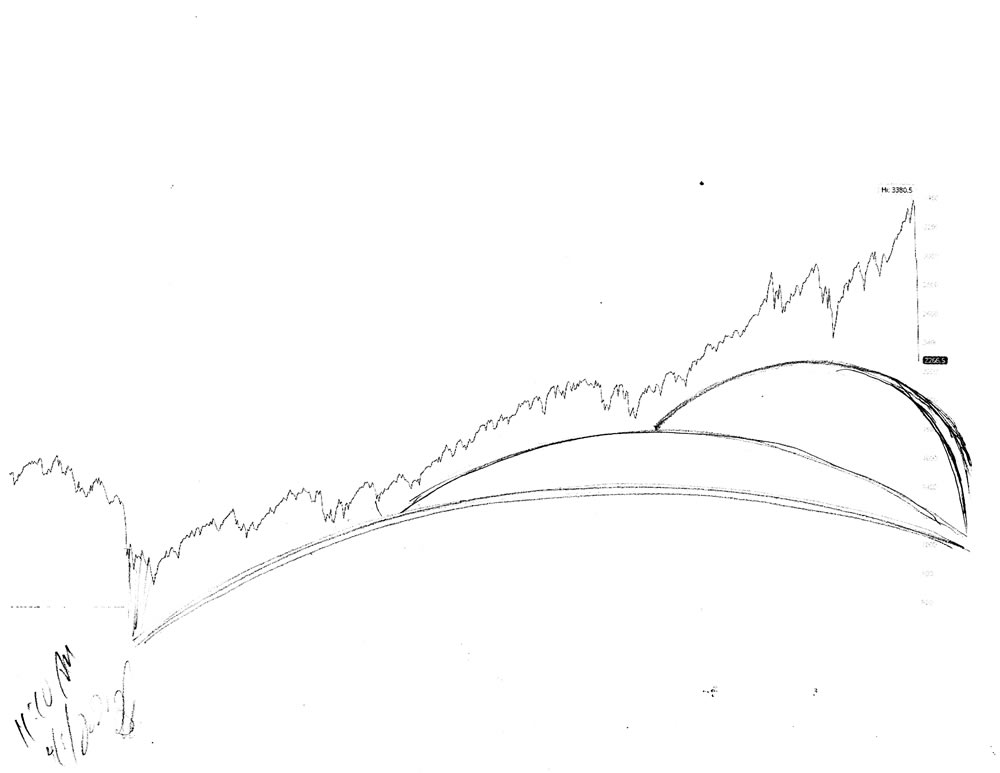
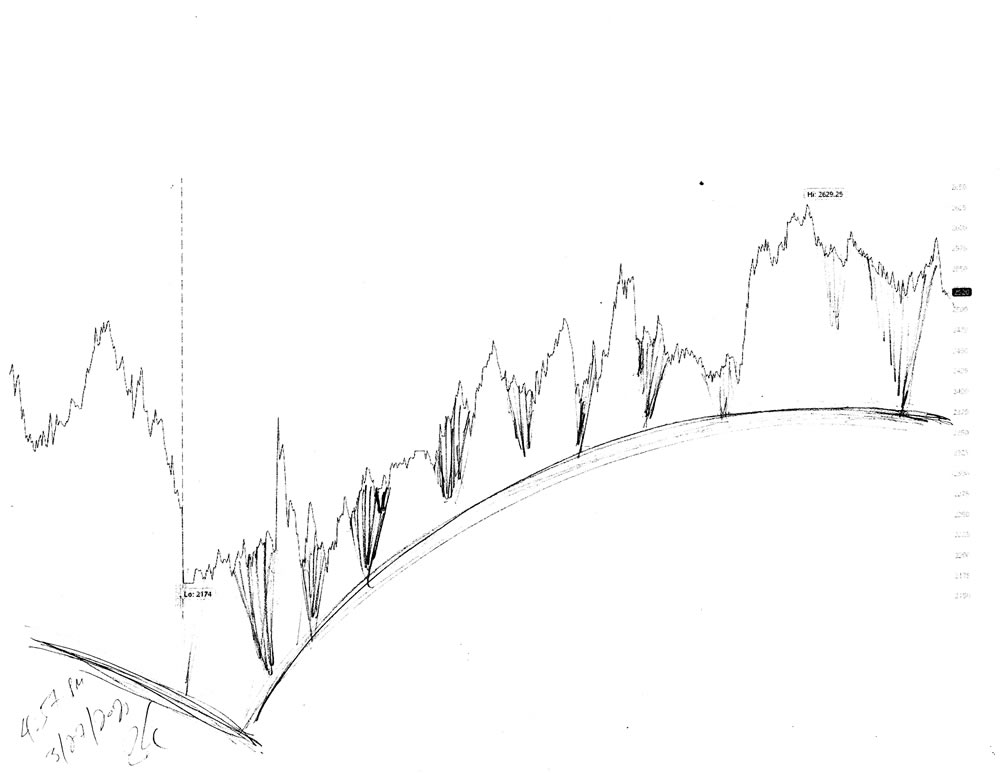
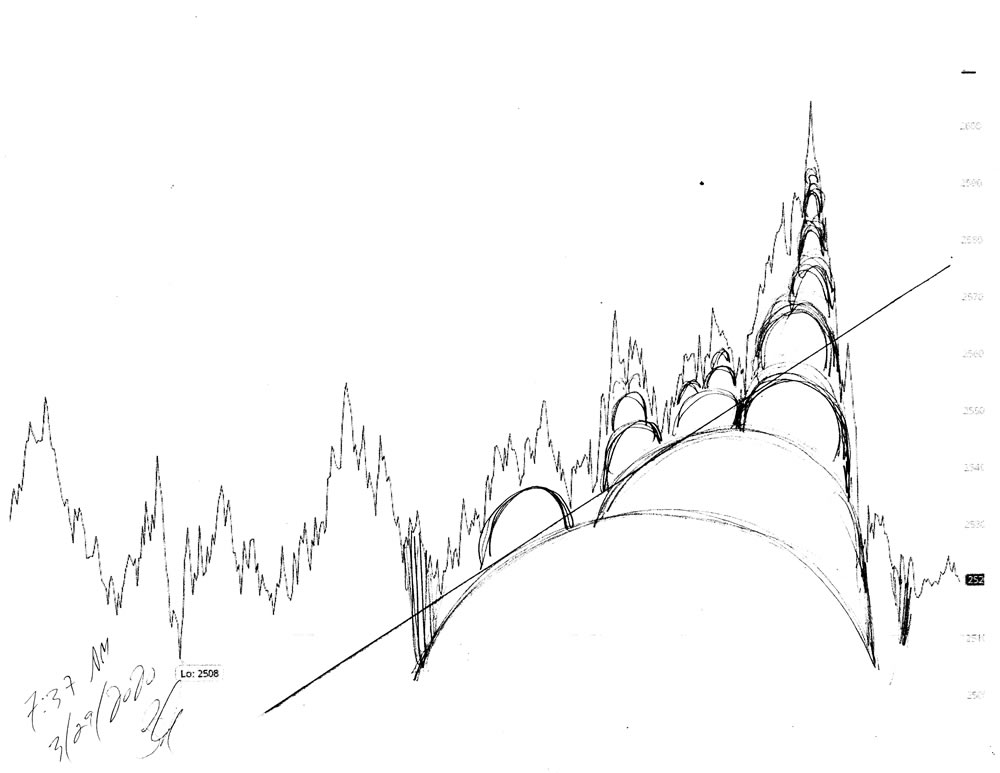
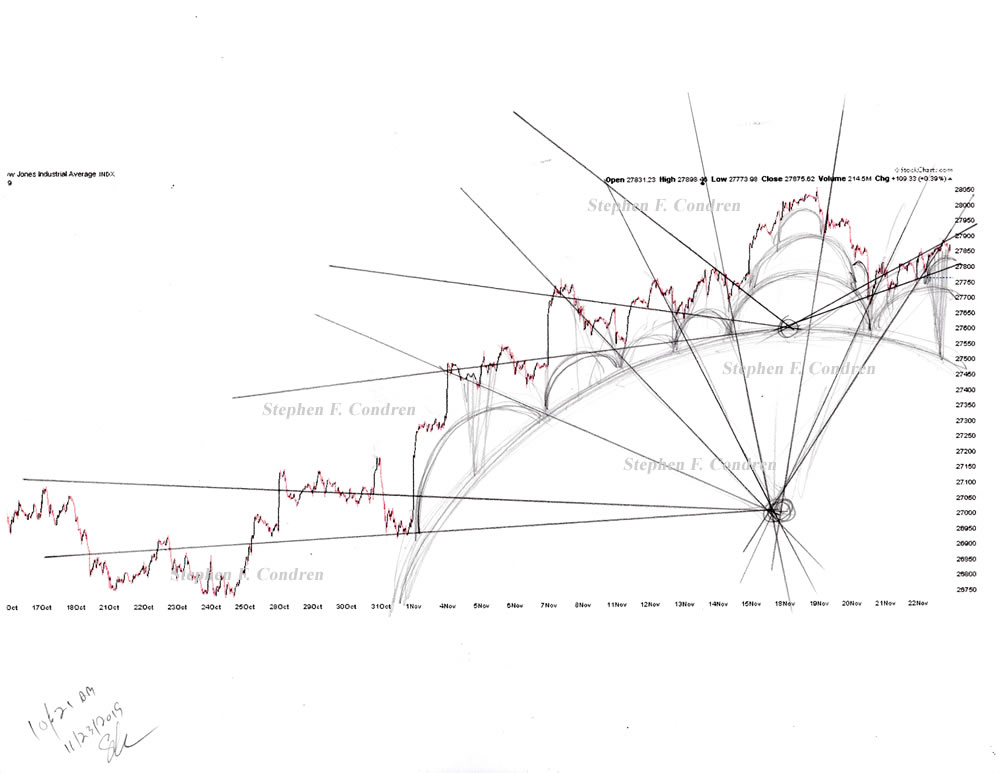
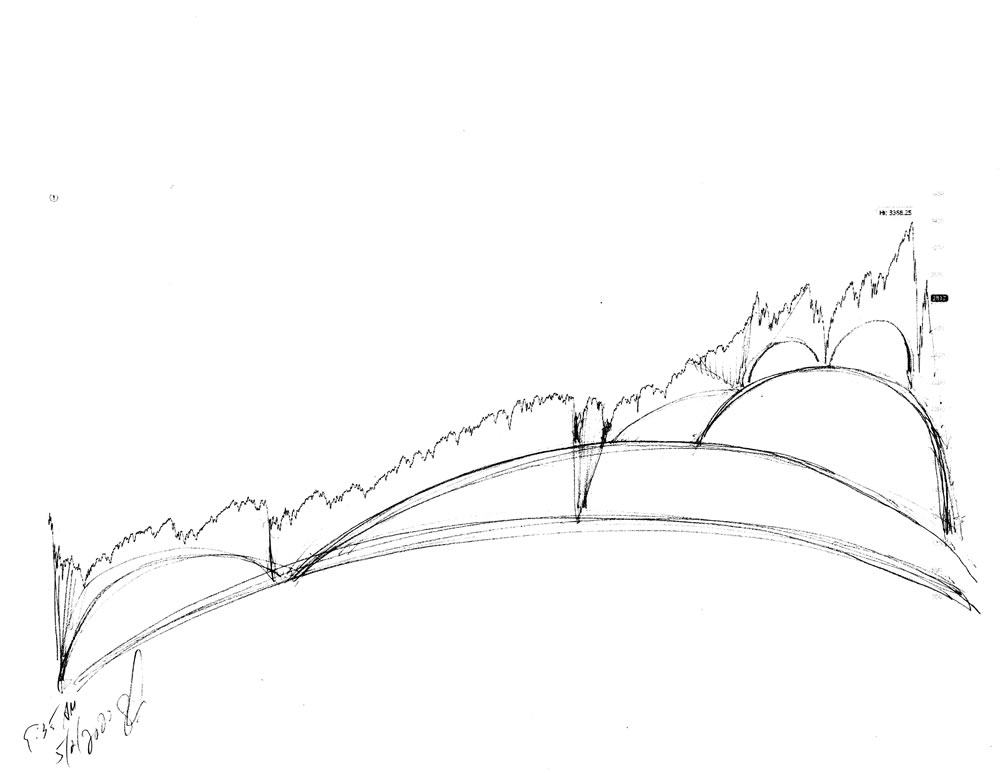
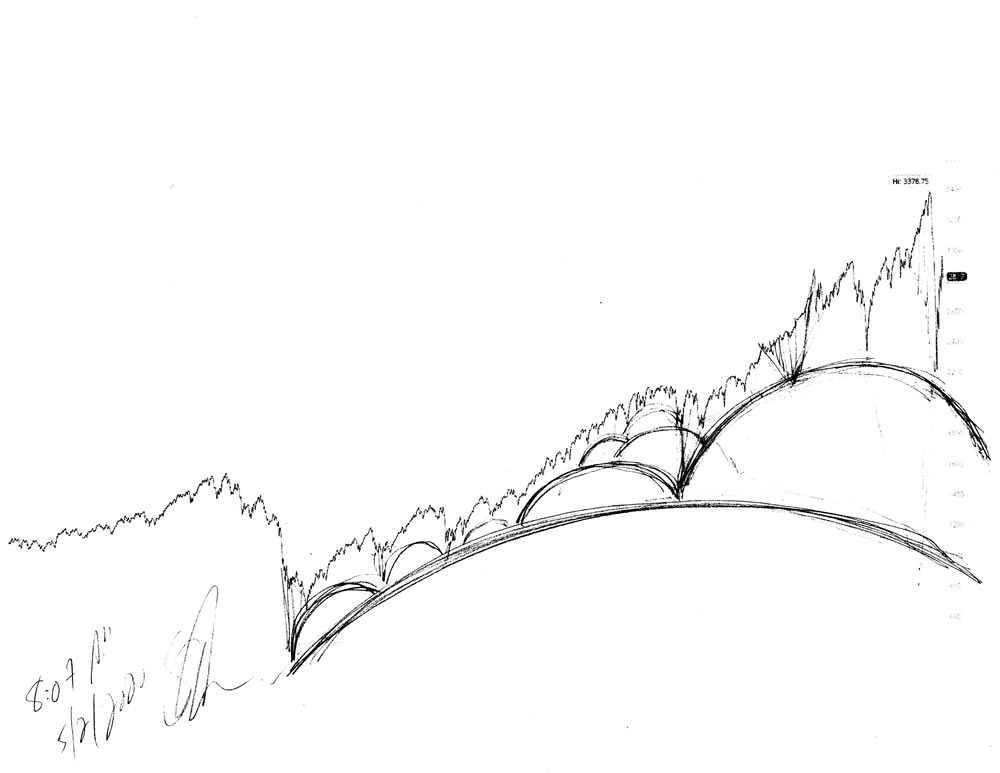
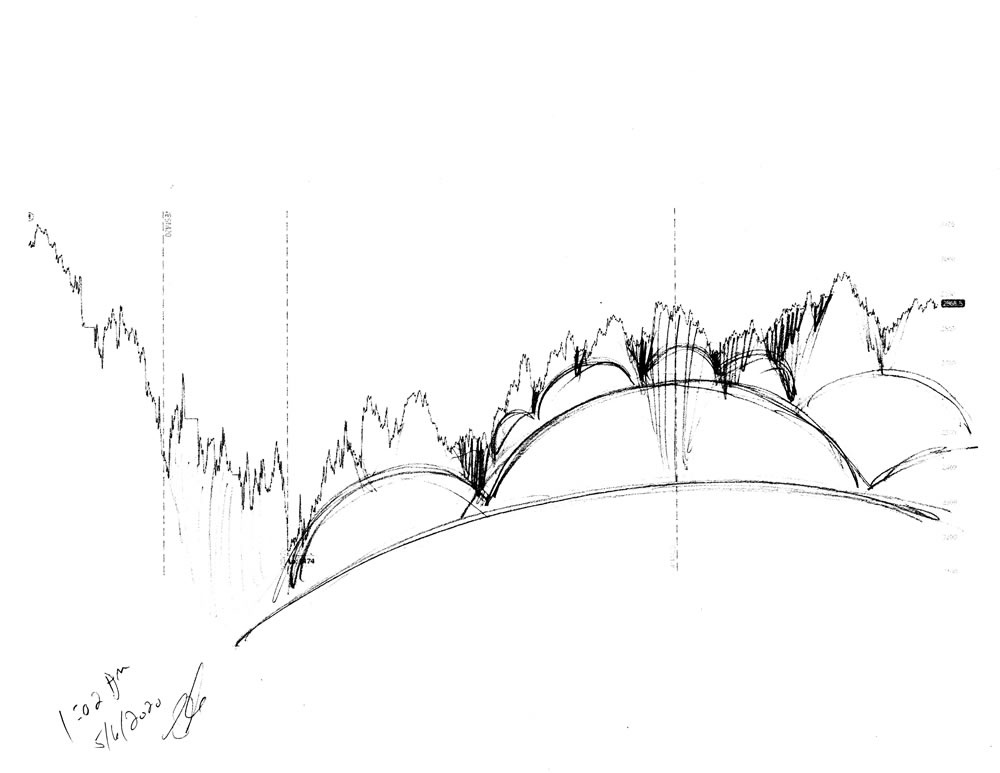
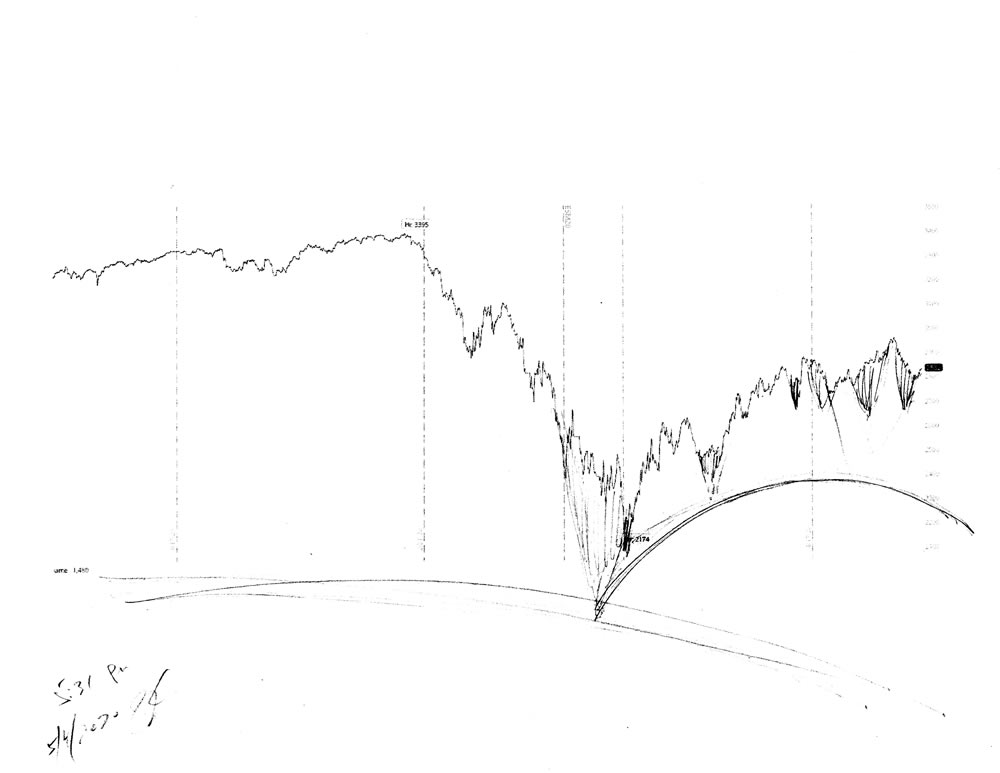
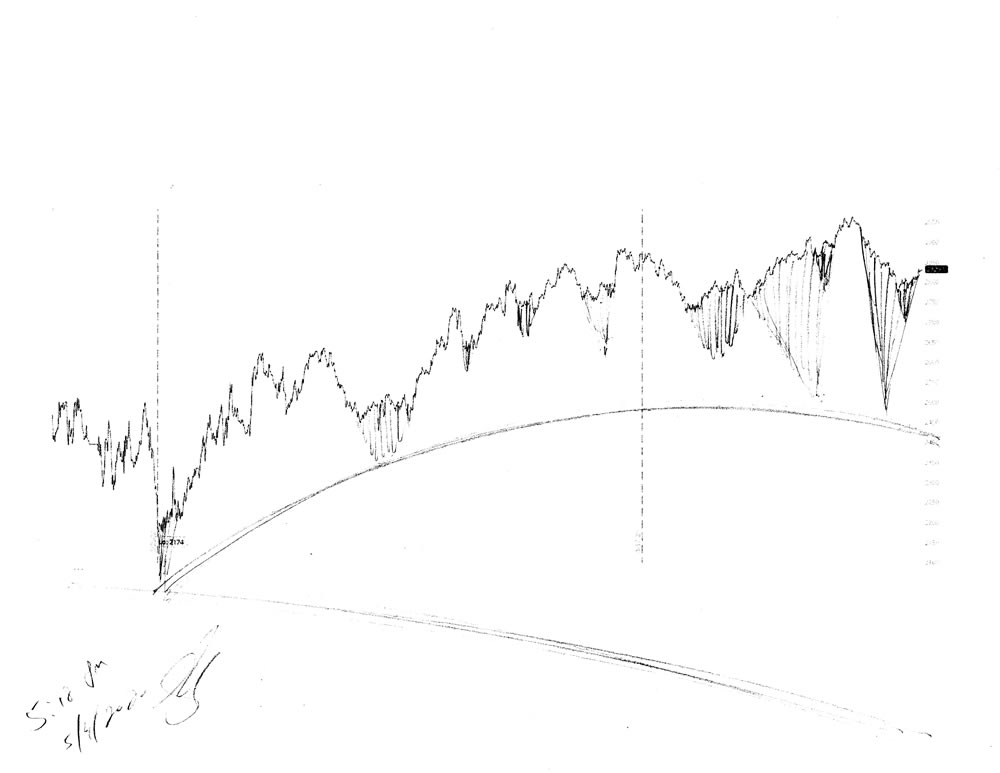
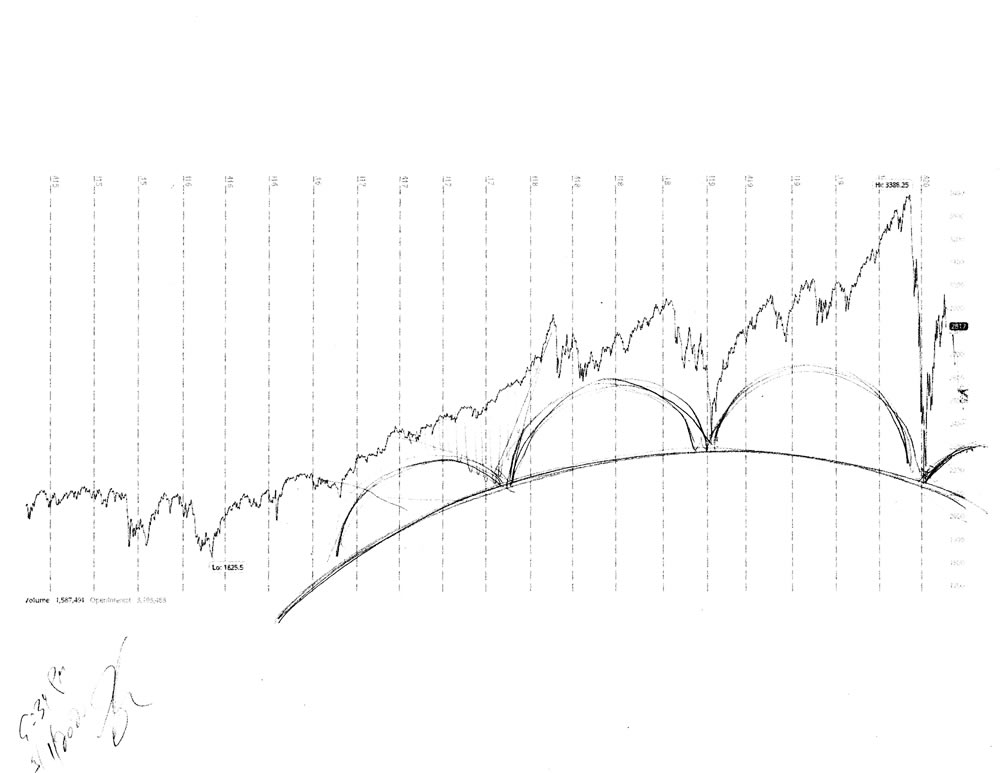
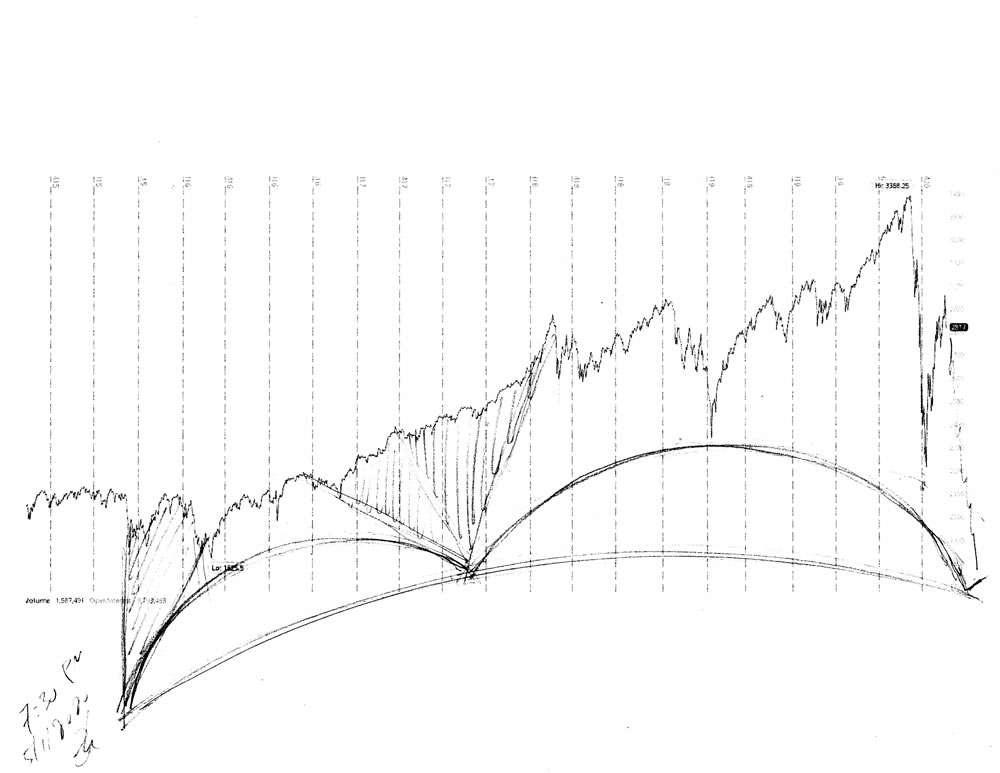
From my chart above can see the my interpretation for the near future of the stock market is in a sharp decline, because the rays show us this. It is the descent of the market from the highest domes that makes the new domes. The crashing down from above with all the thrust and power that gravity can offer pushes the codes down deeply, creating new domes. The new domes that are to arise from this drop will bring the stock market up higher and stronger than ever, surpassing 40,000!

Right Of Passage

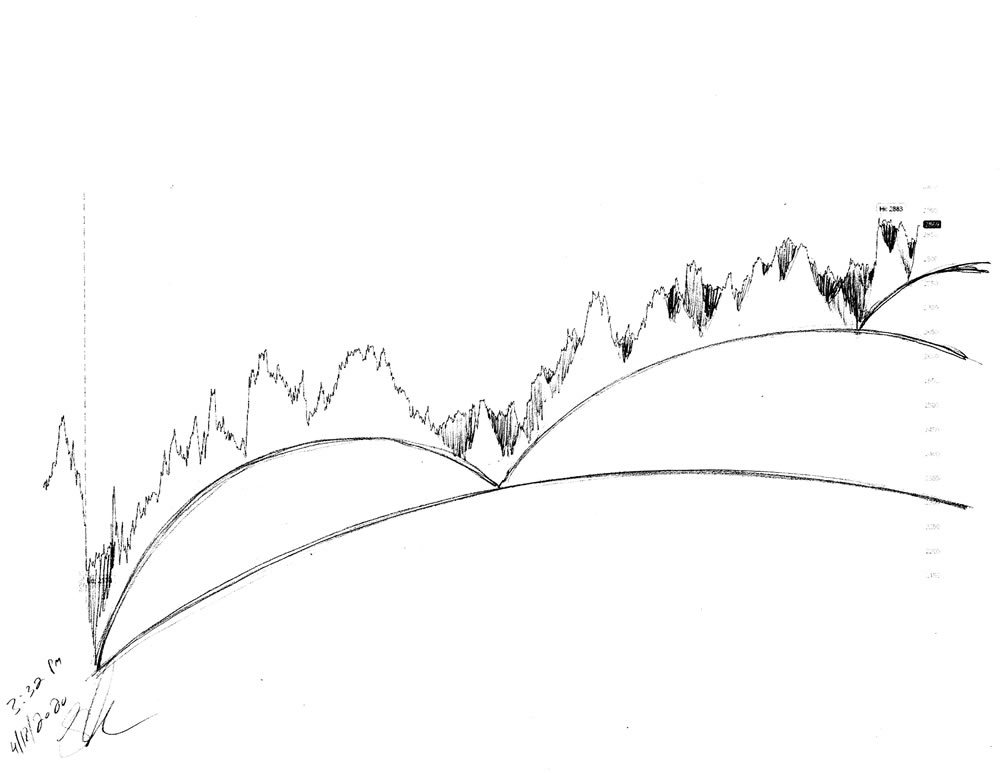
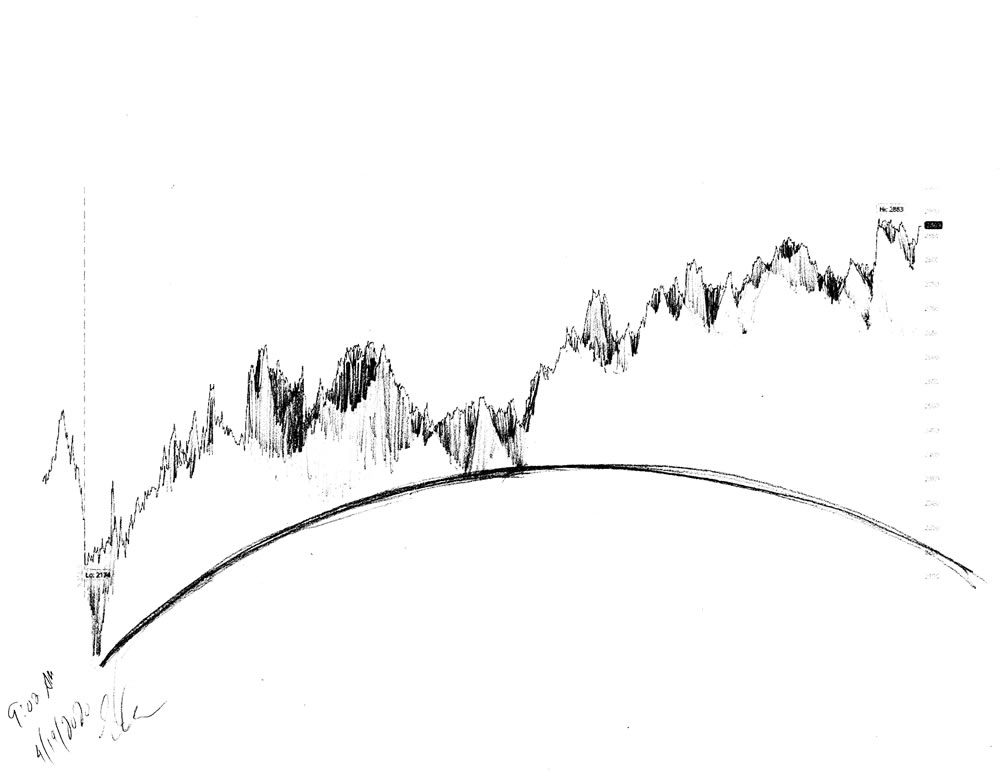
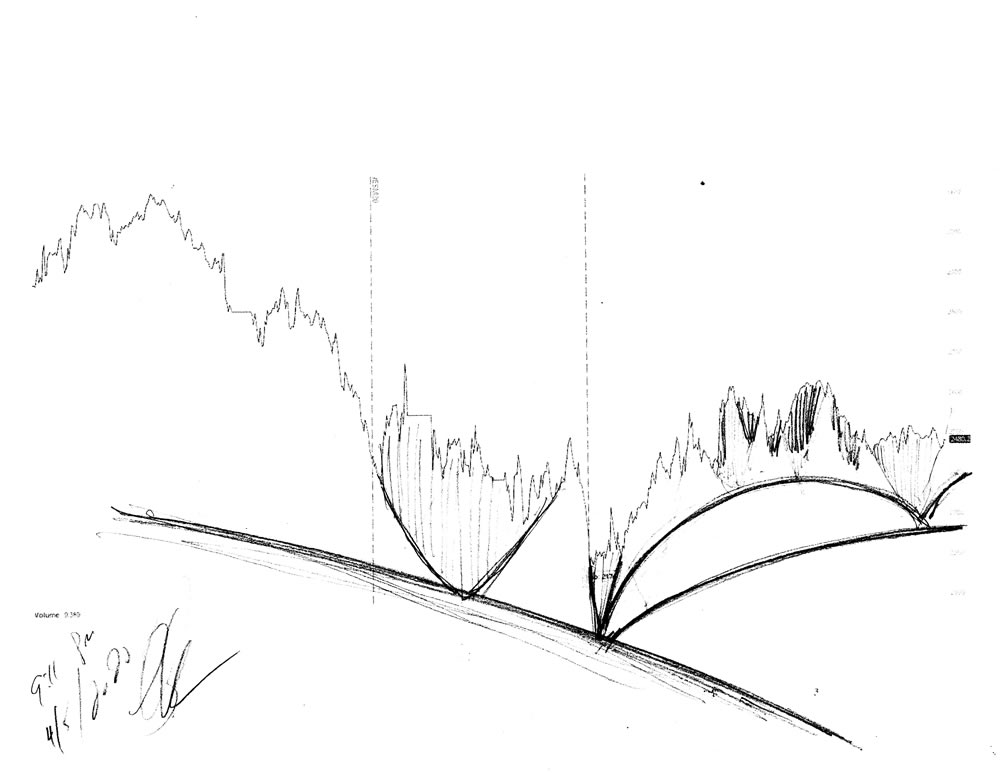
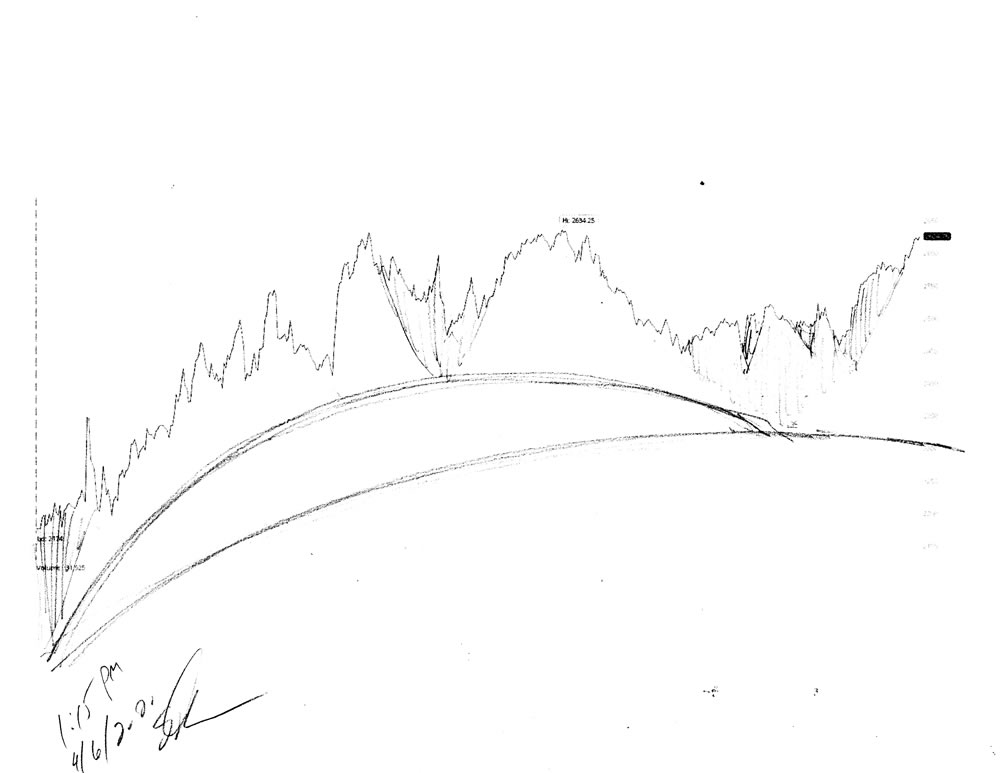
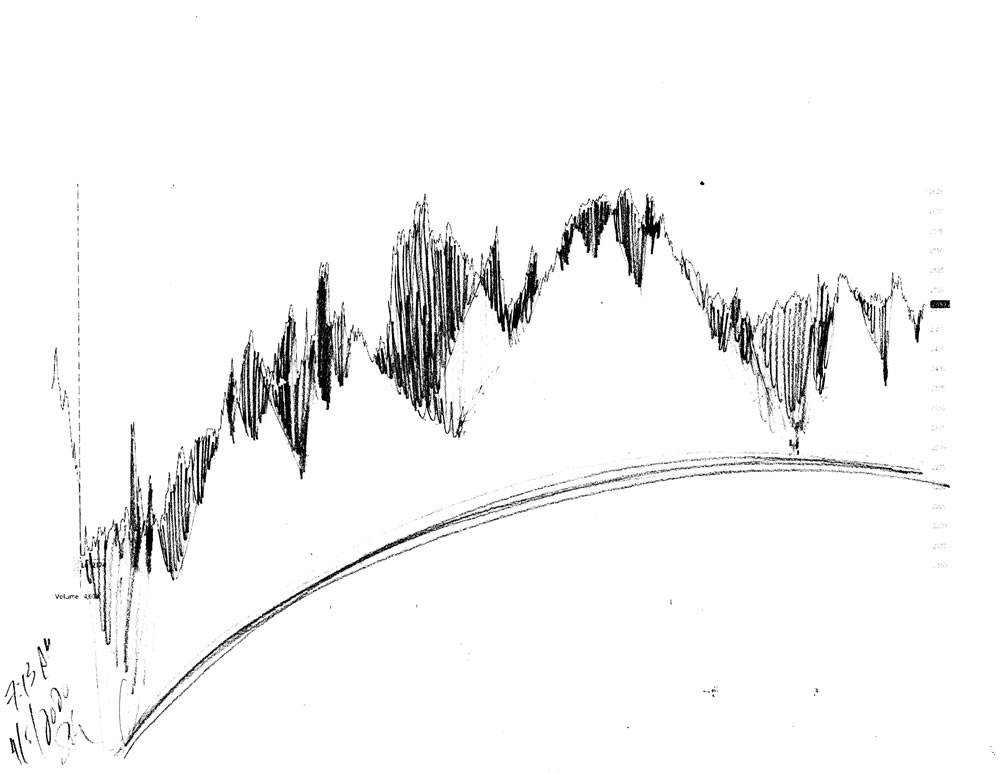
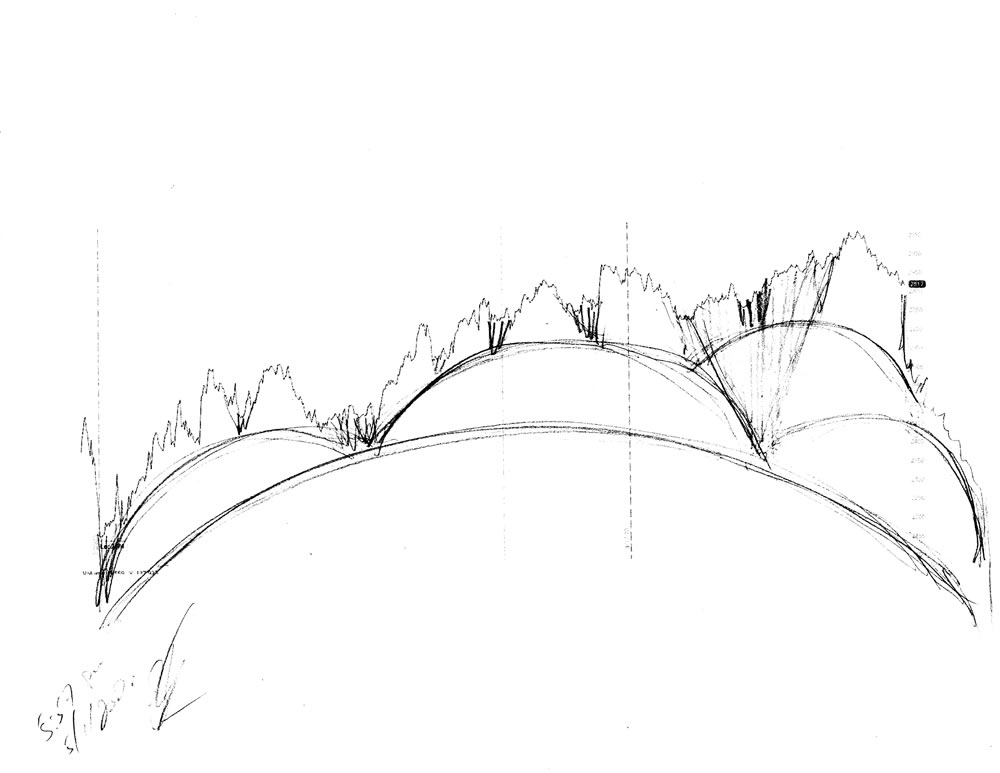
This large dome that we are riding is the new dome created by the smashing of the codes into the larger supporting dome, because this is the process for dome creation. This current newer, and smaller dome is the aegis that will give us a smooth ride down to the very bottom stock market. Another way to look at it is as a diving board and we are the diver going straight down!

Pencil Renderings

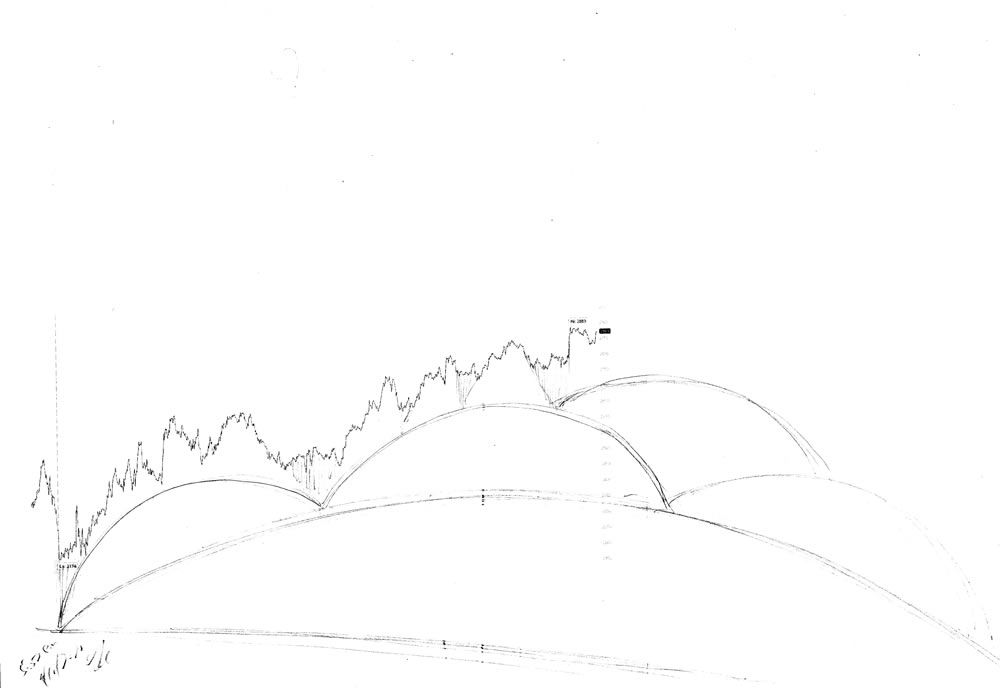
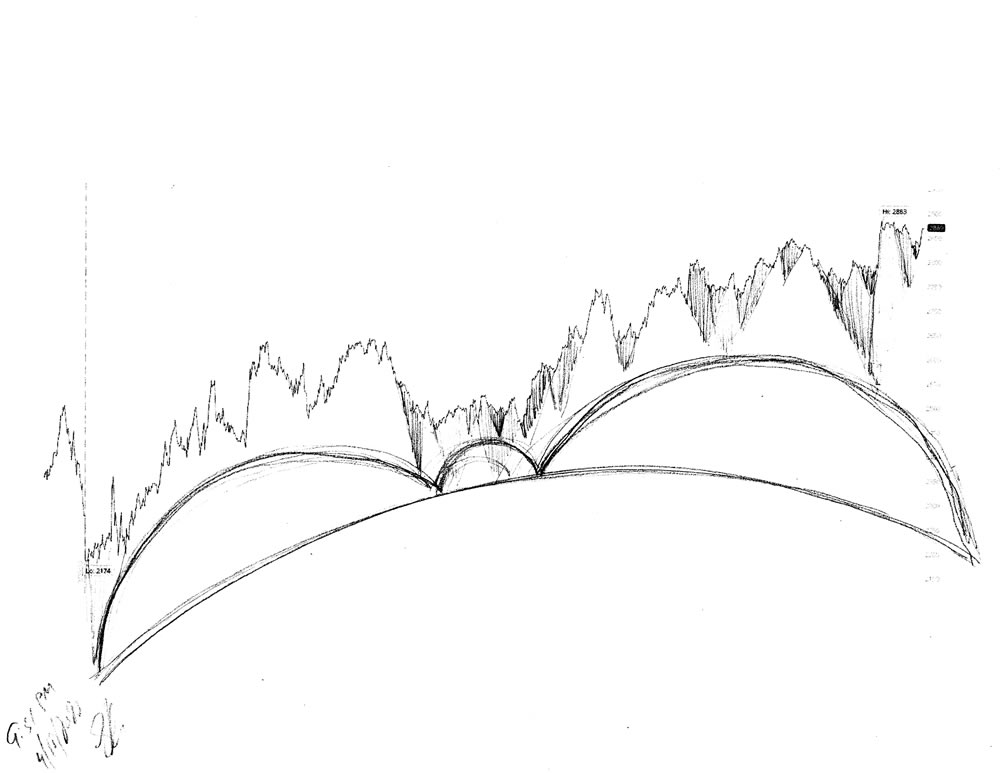
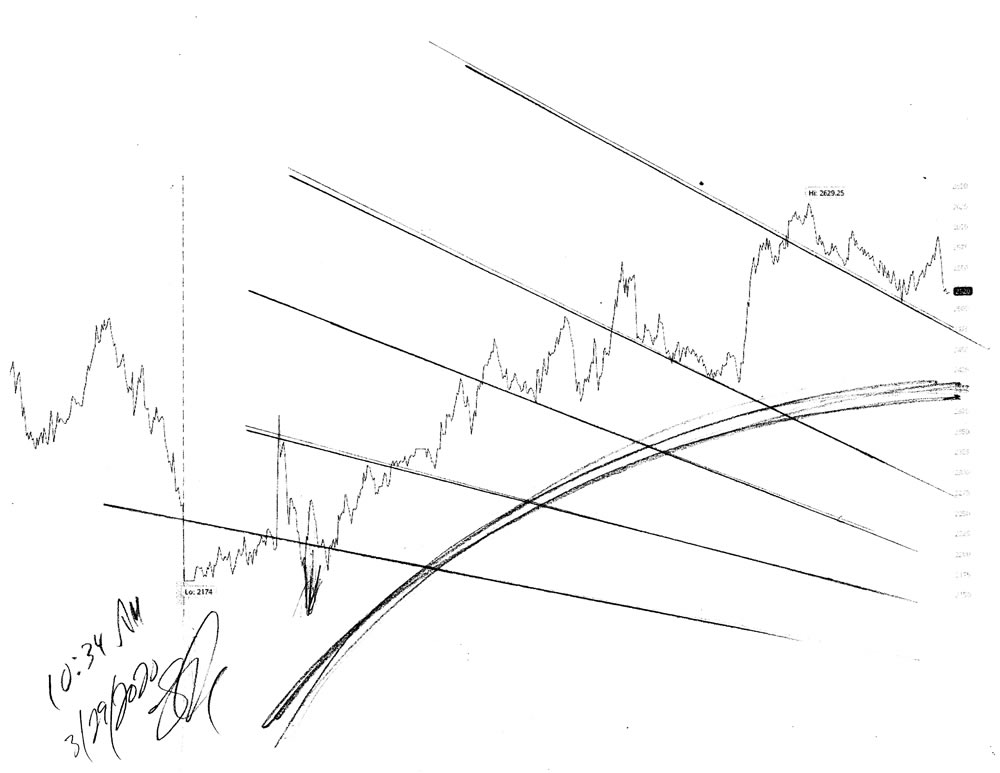
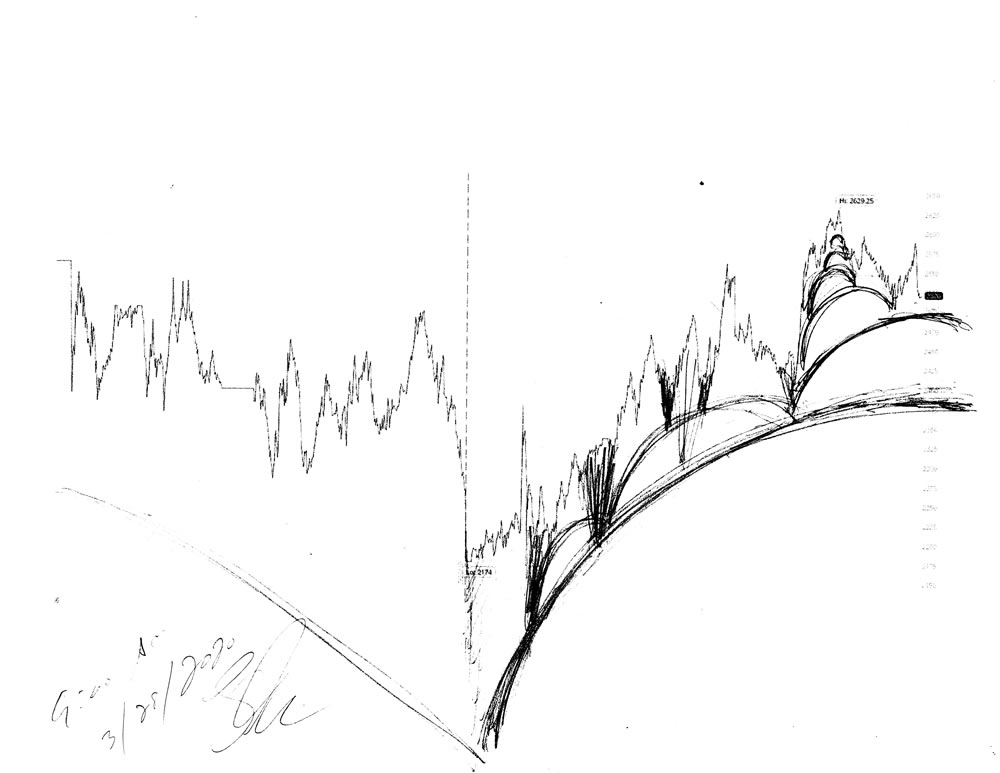
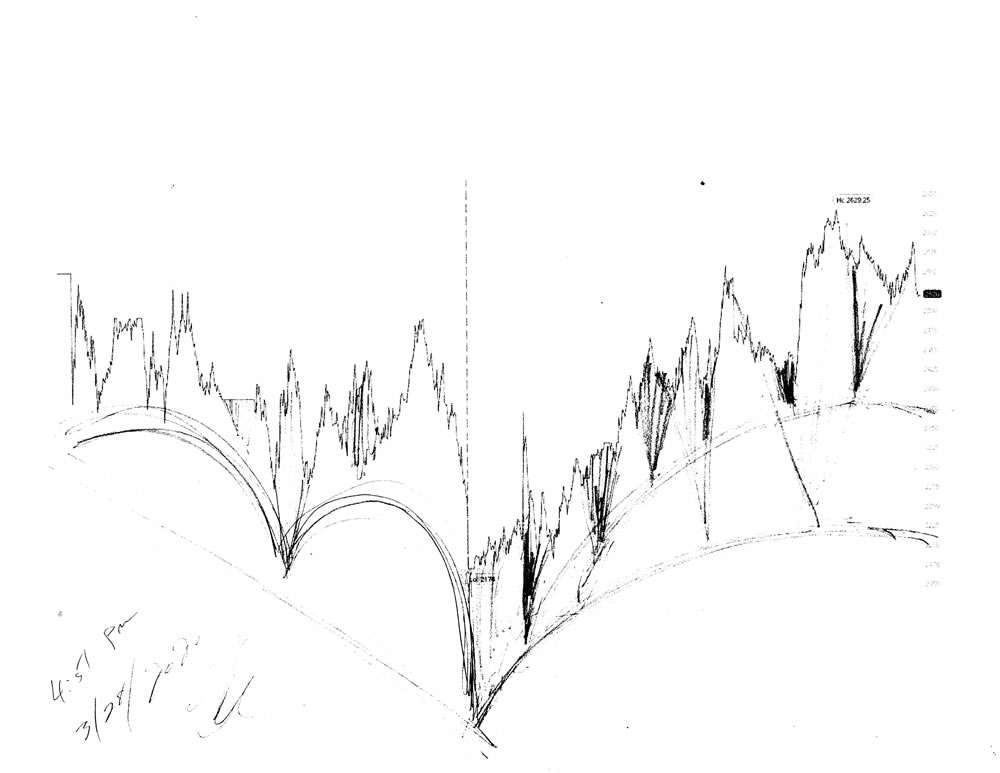
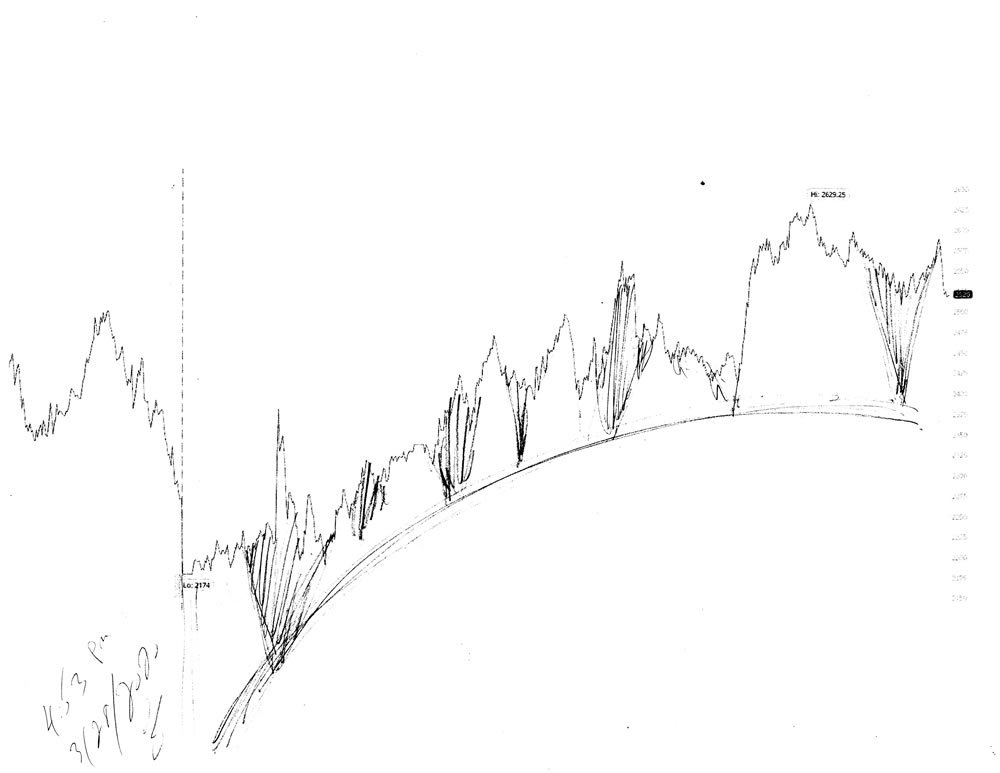
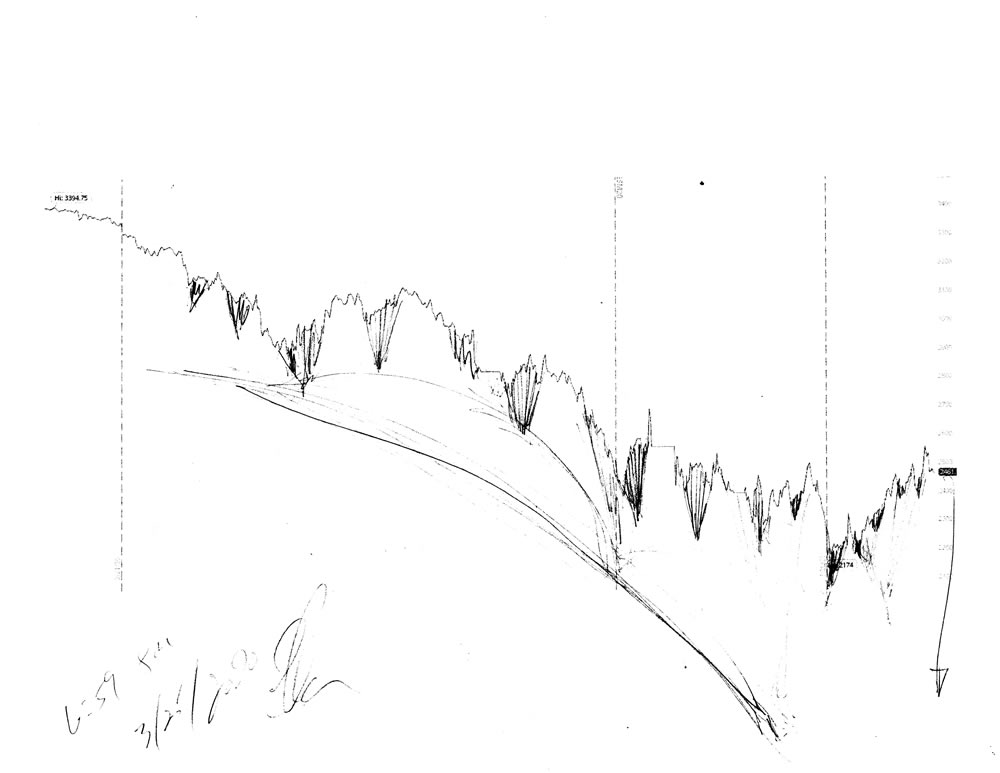
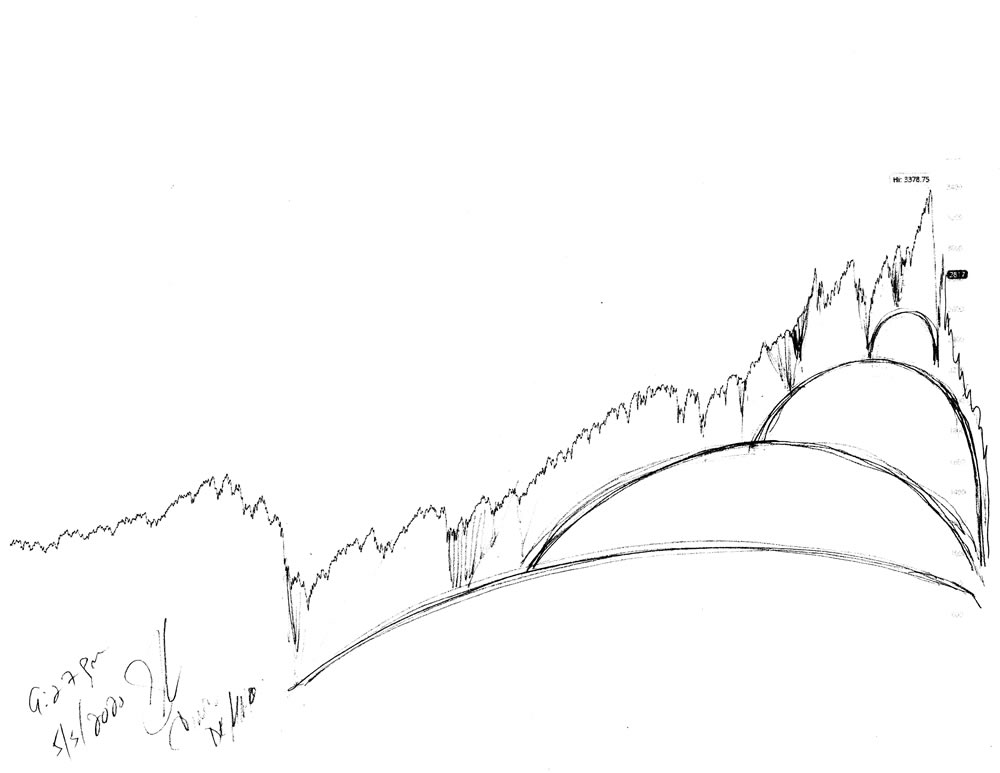
Below are some of my renderings that offer different theories as to how the formation of the domes that make the stock market are aligned. Please understand that it is very difficult to get this down with ironclad clarity, as what we are dong is trying to figure out all of the bubbles (domes) on a soap dish!

Stock market forecast #683Z charts by artist Stephen F. Condren.
1, Stock market forecast charts by artist Stephen F. Condren.
Stock market forecast #683Z charts by artist Stephen F. Condren.
2, Stock market forecast charts by artist Stephen F. Condren.
Stock market forecast #683Z charts by artist Stephen F. Condren.
3, Stock market forecast charts by artist Stephen F. Condren.
Stock market forecast #683Z charts by artist Stephen F. Condren.
4, Stock market forecast charts by artist Stephen F. Condren.
Stock market forecast #683Z charts by artist Stephen F. Condren.
5, Stock market forecast charts by artist Stephen F. Condren.
Stock market forecast #683Z charts by artist Stephen F. Condren.
6, Stock market forecast #683Z charts by artist Stephen F. Condren.
Stock market forecast #683Z charts by artist Stephen F. Condren.
7, Stock market forecast charts by artist Stephen F. Condren.
Stock market forecast #683Z charts by artist Stephen F. Condren.
8, Stock market forecast charts by artist Stephen F. Condren.

Meta Description

Stock market forecast #683Z or stock market architecture charts, pencil rendering by artist Stephen F. Condren with prints & scans predicting future moves.

Alt Image Tag

Stock market forecast #683Z charts by artist Stephen F. Condren.

Image Location

Prints, StockMarket, Dome Architecture, Date

Credits

The charts that are used are from ThinkOrSwim with many thanks.

Stephen F. Condren ~ Artist

Posted on

Stock Market Forecast #682Z

Stock market forecast #682Z charts by artist Stephen F. Condren.

Stock market forecast #682Z or stock market architecture charts, pencil rendering by artist Stephen F. Condren, of Condren Galleries, with prints, and scans predicting future stock market moves. Prints & Scans Of This Drawing #682Z ~ Order Here.

Posted on Google, Facebook, Twitter, Linked-in, and Tumblr.

Stock Market Forecast Video

Stock Market Analysis

From my chart above you can see that the market has produce a new dome, and the current rally of this are the escorts to that new dome, because is how the market crawls along, like an inch worm to move along. The stock market it clearly headed down because all of the rays indicate this.

Stock market forecast #682Z charts by artist Stephen F. Condren.

Pencil Rendering

From my renderings below you can some various studies that are good as samples for possible theories to the stock market’s movement. The last chart below is not a likely candidate, but it is at least on the table.

Stock market forecast #682Z charts by artist Stephen F. Condren.
Geometric chart by artist Stephen F. Condren.
Stock market forecast #682Z charts by artist Stephen F. Condren.
Alternate but unlikely chart by artist Stephen F. Condren.

Meta Description

Stock market forecast #682Z or stock market architecture charts, pencil rendering by artist Stephen F. Condren with prints & scans predicting future moves.

Alt Image Tag

Stock market forecast #682Z charts by artist Stephen F. Condren.

Image Location

Prints, StockMarket, Dome Architecture, 5/2/2020

Credits

The charts that are used are from ThinkOrSwim with many thanks.

Stephen F. Condren ~ Artist

Related Links

Posted on

Stock Market Forecast #681Z

Stock market forecast #681Z charts by artist Stephen F. Condren.

Stock market forecast #681Z or stock market architecture charts, pencil rendering by artist Stephen F. Condren, of Condren Galleries, with prints, and scans predicting future stock market moves. Prints & Scans Of This Drawing #681Z ~ Order Here.

Posted on Google, Facebook, Twitter, Linked-in, and Tumblr.

Stock Market Forecast Video

Stock Market Analysis

In my chart above you can see that we are near the top of this region, and preparing to head downward, because this is demanded by the codes. A key understanding of Dome Architecture is the formation of patterns, and how to recognize them.

Pencil Rendering

In my rendering below you can see an overall view of the market for more than a decade, because this offers a view of how the domes are aligned. The domes are a cluster of bubbles that are mounted upon each other, much like that of a soap dish. In this rendering you can see how the largest dome is commenced at the crash of 2008.

Stock market forecast #681Z charts by artist Stephen F. Condren.

Meta Description

Stock market forecast #681Z or stock market architecture charts, pencil rendering by artist Stephen F. Condren with prints & scans predicting future moves.

Alt Image Tag

Stock market forecast #681Z charts by artist Stephen F. Condren.

Image Location

Prints, StockMarket, Dome Architecture, Date

Credits

The charts that are used are from ThinkOrSwim with many thanks.

Stephen F. Condren ~ Artist

Related Links

Posted on

Stock Market Forecast #680Z

Stock market forecast #680Z charts by artist Stephen F. Condren.

Stock market forecast #680Z or stock market architecture charts, pencil rendering by artist Stephen F. Condren, of Condren Galleries, with prints, and scans predicting future stock market moves. Prints & Scans Of This Drawing #680Z ~ Order Here.

Posted on Google, Facebook, Twitter, Linked-in, and Tumblr.

Stock Market Forecast Video

Stock Market Analysis

As you can see from my chart above the stack of domes are converging at the 2200 level (SPX), because this is the pattern of the codes. Like an oak leave, which is a code, the market forces are as blind as a bat, thus they need the pattern of the code to follow to create the market formation.

Pencil Rendering

The pencil rendering is an offering of my perception of the market codes, and of course are subject to error. However, it must be understood that I am not casting my graphs on the whim of opinion, rather my graphs, and charts are rooted in facts. Like a good lawyer, it is the proper interpretation of the fact that renders a good solution.

Meta Description

Stock market forecast #680Z or stock market architecture charts, pencil rendering by artist Stephen F. Condren with prints & scans predicting future moves.

Alt Image Tag

Stock market forecast #680Z charts by artist Stephen F. Condren.

Credits

The charts that are used are from Charles Schwab, with many thanks.

Stephen F. Condren ~ Artist

Related Links

Posted on

Stock Market Crash #678Z

Stock market forecast #678Z charts by artist Stephen F. Condren.

Stock market forecast #678Z or stock market architecture charts, pencil rendering by artist Stephen F. Condren, of Condren Galleries, with prints, and scans predicting future stock market moves. Prints & Scans Of This Drawing #678Z ~ Order Here.

Posted on Google, Facebook, Twitter, Linked-in, and Tumblr.

Stock Market Forecast Video

Geometry

It is all geometric. If you look carefully, you can see many of the countless domes, angles, alignments, and rays that all work together to formulate the Stock Market.

Stock Market Analysis

From my chart above you can see the dramatic crash that the stock market has gone through, and that I have clearly predicted in my video directly above. As you can see from the three large pointers, they offer us the location of the greater dome that supports this region that we are currently in.

Pencil Rendering

In my rendering below is a detail of the current, smaller dome that was created right after the crash. The motion of a dome coming down and touching the larger dome that it rests on creates a new dome. In this case the codes call for a smaller dome, and it is also resting on the greater dome that contains both smaller domes. Of course you can see that the greater, and larger dome that supports these domes is heading down.

Stock market forecast #678Z charts by artist Stephen F. Condren.

Dome Architecture

In my rendering below is an example of my studies on Dome Architecture, which in correlation with the stock market codes, form the patterns that make up the stock market. To find the domes you have to carefully go through many footers and select the right ones that makes sense to the image of the region.

Stock market forecast #678Z charts by artist Stephen F. Condren.
Proposed Stock Market forecast by artist Stephen F. Condren.

Other Variations Of Dome Architecture

Stock market forecast #678Z charts by artist Stephen F. Condren.
1. Market forecast #678Z charts by artist Stephen F. Condren.
Stock market forecast #678Z charts by artist Stephen F. Condren.
2. Market forecast #678Z charts by artist Stephen F. Condren.
Stock market forecast #678Z charts by artist Stephen F. Condren.
3. Market forecast #678Z charts by artist Stephen F. Condren.
Stock market forecast #678Z charts by artist Stephen F. Condren.
4. Market forecast #678Z charts by artist Stephen F. Condren.
Stock market forecast #678Z charts by artist Stephen F. Condren.
5. Market forecast #678Z charts by artist Stephen F. Condren.
Stock market forecast #678Z charts by artist Stephen F. Condren.
6. Market forecast #678Z charts by artist Stephen F. Condren.

Meta Description

Stock market forecast #678Z or stock market architecture charts, pencil rendering by artist Stephen F. Condren with prints & scans predicting future moves.

Alt Image Tag

Stock market forecast #678Z charts by artist Stephen F. Condren.

Image Location

Prints, Stock Market, 2020, April 4/17/2020

Credits

The charts that are used are from ThinkOrSwim with many thanks.

Stephen F. Condren ~ Artist

Related Links

Posted on

Stock Market Forecast #679Z

Stock market forecast #679Z charts by artist Stephen F. Condren.

Stock market forecast #679Z or stock market architecture charts, pencil rendering by artist Stephen F. Condren, of Condren Galleries, with prints, and scans predicting future stock market moves. Prints & Scans Of This Drawing #679Z ~ Order Here.

Posted on Google, Facebook, Twitter, Linked-in, and Tumblr.

Stock Market Forecast Video

Stock Market Analysis

As you can see from my chart above we are not near the peak of the new dome made by the crash, because new domes are made from the previous dome touching the common dome that supports them both. Now it must be understood that there are thousands of various renderings that can be made of the stock market, however, these renderings are based on fact, not opinion, because I use the intersection points, or footers, to show the path of the market.

Pencil Rendering

In my rendering below you can see the delineation for the entire region showing the downward progression of the stock market. This is very much like slinkies down stairs!

Stock market forecast #679Z charts by artist Stephen F. Condren.

Meta Description

Stock market forecast #679Z or stock market architecture charts, pencil rendering by artist Stephen F. Condren with prints & scans predicting future moves.

Alt Image Tag

Stock market forecast #679Z charts by artist Stephen F. Condren.

Image Location

Prints, Stock Market, 2020, April 4/17/2020

Credits

The charts that are used are from ThinkOrSwim with many thanks.

Stephen F. Condren ~ Artist

Related Links

Posted on

Stock Market Forecast #677Z

Stock market forecast #677Z charts by artist Stephen F. Condren.

Stock market forecast #677Z or stock market architecture charts, pencil rendering by artist Stephen F. Condren, of Condren Galleries, with prints, and scans predicting future stock market moves. Prints & Scans Of This Drawing #677Z ~ Order Here.

Posted on Google, Facebook, Twitter, Linked-in, and Tumblr.

Stock Market Forecast Video

Stock Market Analysis

In my chart above you can see that I have delineated the current dome of the last 11 days, because this is the form of the set of codes for this region. We are now in a finial rally that when completed will head the market down quickly to lower levels at the 2,000 range for SPX.

Pencil Rendering

The charts below are variations on the same theme offering different possibilities, which are endless.

Stock market forecast #677Z charts by artist Stephen F. Condren.
1, Market forecast #677Z charts by artist Stephen F. Condren.
Stock market forecast #677Z charts by artist Stephen F. Condren.
2, Market forecast #677Z charts by artist Stephen F. Condren.
Stock market forecast #677Z charts by artist Stephen F. Condren.
3, Market forecast #677Z charts by artist Stephen F. Condren.
Stock market forecast #677Z charts by artist Stephen F. Condren.
4, Market forecast #677Z charts by artist Stephen F. Condren.
Stock market forecast #677Z charts by artist Stephen F. Condren.
5, Market forecast #677Z charts by artist Stephen F. Condren.
Stock market forecast #677Z charts by artist Stephen F. Condren.
6, <arket forecast #677Z charts by artist Stephen F. Condren.
Stock market forecast #677Z charts by artist Stephen F. Condren.
7, Stock market forecast #677Z charts by artist Stephen F. Condren.

Meta Description

Market forecast #677Z or stock market architecture charts, pencil rendering by artist Stephen F. Condren with prints & scans predicting future moves.

Alt Image Tag

Stock market forecast #677Z charts by artist Stephen F. Condren.

Image Location

Prints, StockMarket, Dome Architecture, Date

Credits

The charts that are used are from ThinkOrSwim with many thanks.

Stephen F. Condren ~ Artist

Related Links

Posted on

Stock Market Forecast #676Z

Stock market forecast #676Z charts by artist Stephen F. Condren.

Stock market forecast #676Z or stock market architecture charts, pencil rendering by artist Stephen F. Condren, of Condren Galleries, with prints, and scans predicting future stock market moves. Prints & Scans Of This Drawing #000Z ~ Order Here.

Posted on Google, Facebook, Twitter, Linked-in, and Tumblr.

Stock Market Forecast Video

Market Analysis

As you can see from my chart above the market is at the center of the dome that will be the bridge to the next larger dome that lies below, because this is mandated by the codes.

Pencil Rendering

The renderings that I have provided below are variations on the same theme with different time frames, because these reflect the many variables in trying to delineate all of the bubbles on a soap dish!

Stock market forecast #676Z charts by artist Stephen F. Condren.
Market forecast #676Z charts by artist Stephen F. Condren.
Stock market forecast #676Z charts by artist Stephen F. Condren.
Forecast #676Z charts by artist Stephen F. Condren.
Stock market forecast #676Z charts by artist Stephen F. Condren.
1, Stock market forecast chart pencil drawing by artist Stephen F. Condren. #675Z
Stock market forecast #676Z charts by artist Stephen F. Condren.
2, Stock market forecast chart pencil drawing by artist Stephen F. Condren. #675Z
Stock market forecast #676Z charts by artist Stephen F. Condren.
3, Stock market forecast chart pencil drawing by artist Stephen F. Condren. #675Z
Stock market forecast #676Z charts by artist Stephen F. Condren.
4, Stock market forecast chart pencil drawing by artist Stephen F. Condren. #675Z
Stock market forecast #676Z charts by artist Stephen F. Condren.
5, Stock market forecast chart pencil drawing by artist Stephen F. Condren. #675Z
Stock market forecast #676Z charts by artist Stephen F. Condren.
6, Stock market forecast chart pencil drawing by artist Stephen F. Condren. #675Z
Stock market forecast #676Z charts by artist Stephen F. Condren.
7, Stock market forecast chart pencil drawing by artist Stephen F. Condren. #675Z
Stock market forecast #676Z charts by artist Stephen F. Condren.
8, Stock market forecast chart pencil drawing by artist Stephen F. Condren. #675Z
Stock market forecast #676Z charts by artist Stephen F. Condren.
9, Stock market forecast chart pencil drawing by artist Stephen F. Condren. #675Z
Stock market forecast #676Z charts by artist Stephen F. Condren.
10, Stock market forecast chart pencil drawing by artist Stephen F. Condren. #675Z
Stock market forecast #676Z charts by artist Stephen F. Condren.
11, Stock market forecast chart pencil drawing by artist Stephen F. Condren. #675Z

Meta Description

Stock market forecast #676Z or stock market architecture charts, pencil rendering by artist Stephen F. Condren with prints & scans predicting future moves.

Alt Image Tag

Stock market forecast #676Z charts by artist Stephen F. Condren.

Image Location

Prints, Stock Market, 2020, April 3/27/2020

Credits

The charts that are used are from Charles Schwab, with many thanks.

Stephen F. Condren ~ Artist

Related Links

Posted on

Stock Market Forecast #675Z

Stock market forecast #675Z charts by artist Stephen F. Condren.

Stock market forecast #675Z or stock market architecture charts, pencil rendering by artist Stephen F. Condren, of Condren Galleries, with prints, and scans predicting future stock market moves. Prints & Scans Of This Drawing #675Z ~ Order Here.

Posted on Google, Facebook, Twitter, Linked-in, and Tumblr.

Stock Market Forecast Video

As you can see from my drawing above we are a the top of the bubble that will carry the stock market over, and down to the next echelon, because the stock market is going very far down.

My prophetic video above clearly shows that my Science of Dome Architecture is correct, because it is based on fact.

Detail Of Dome Architecture

Stock market forecast #675Z charts by artist Stephen F. Condren.
1. Stock market forecast chart.

Above is a detail of the last half of the trading day on March 27, 2020. This drawing clearly show how dome architecture supports the stock market, and how rays align the dome or bubbles to form the codes. This last part of the trading day ominously shows the same code for the stock market since 2008, all of which I have predicted, and have posted online.

Rays

The Rays Will Save You

Stock market forecast #675Z charts by artist Stephen F. Condren.
Stock market forecast chart.

From my chart above you can see the array of rays all bending down to the right. This is because they are aiming at the core, or center of the regional dome. Because the rays are pointing to the right this means that we are climbing up the dome, and are now at the top. Thus, most probably there bill be a series of smaller bubbles forming a finial like the chart directly above this one. My famous phrase is: The rays will save you.

Pencil Renderings

Stock market forecast #675Z charts by artist Stephen F. Condren.
2. Stock market forecast chart.
Stock market forecast #675Z charts by artist Stephen F. Condren.
3. Stock market forecast chart.
Stock market forecast #675Z charts by artist Stephen F. Condren.
4. Stock market forecast chart.

In my renderings above are other variations on the same theme. You can see that the footers clearly denote the curve of the current bubble, because they give the path of the arch.

Shorting The Stock Market

In my thinking that in general it is best to short the market, because you are given a history to work with. Thus, in today’s rendering I can look at the chart and calculate that it is best to short the market on Monday or Tuesday, depending on how the codes of the market are formed over the weekend. It is very difficult to go long on the market because no chart has been created yet, sort of like going into uncharted waters.

2.2 Trillion Dollar Stimulus Law

This paragraph is written at 3:10 PM, on 3/28/2020. With the passing into law the titanic stimulus package it stands to reason that the stock market will rally substantially in the Sunday evening futures markets, and on Monday morning at the opening bell.

FOMC

However, like the FOMC announcement of last December that set the stock market on a 3,000 point rally for three months, this stimulus package will eventually be absorbed, and the stock market will again continue it’s path downward.

Meta Description

Stock market forecast #675Z or stock market architecture charts, pencil rendering by artist Stephen F. Condren with prints & scans predicting future moves. I am predicting that the stock market will go down another 10,000 points.

Alt Image Tag

Stock market forecast #675Z charts by artist Stephen F. Condren.

Image Location

Prints, StockMarket, Dome Architecture, Date

Credits

The charts that are used are from Charles Schwab, with many thanks.

Stephen F. Condren ~ Artist

Related Links

Stock Market Forecast #674Z

Posted on

Stock Market Forecast #674Z

Stock market forecast #674Z charts by artist Stephen F. Condren.

Stock market forecast #674Z or stock market architecture charts, pencil rendering by artist Stephen F. Condren, of Condren Galleries, with prints, and scans predicting future stock market moves. Prints & Scans Of This Drawing #674Z ~ Order Here.

Posted on Google, Facebook, Twitter, Linked-in, and Tumblr.

Stock Market Architecture

Forecast 1/4//2020

Stock Market Analysis

As you can see from my chart above the stock market is headed straight down, because this is demanded by the codes that form it’s path. The area between March 12th & 20th is a cap (a bubble that cover a deep fissure), which can be seen by the alignment of the rays that meet way down below the 17th of March.

Pencil Rendering

The rendering give a good perspective of how the bubbles, or domes are set upon each other to form the structure that we call the stock market.

Meta Description

Stock market forecast #674Z or stock market architecture charts, pencil rendering by artist Stephen F. Condren with prints & scans predicting future moves.

Alt Image Tag

Stock market forecast #674Z charts by artist Stephen F. Condren.

Image Location

Prints, StockMarket, Dome Architecture, Date

Credits

The charts that are used are from Charles Schwab, with many thanks.

Stephen F. Condren ~ Artist

Related Links

Stock Market Forecast #673Z