Posted on

Stock Market Architecture #609Z

Stock market architecture #609Z or stock market analysis, by artist Stephen F. Condren.

Stock market architecture #609Z or stock market forecast charts, pencil rendering by artist Stephen F. Condren, of Condren Galleries, with prints, and scans. Prints & Scans Of This Drawing #609Z ~ Order Here.

Posted on Google+, Facebook, Twitter, Linked-in, and Tumblr.

Stock Market Architecture

Stock Market Analysis

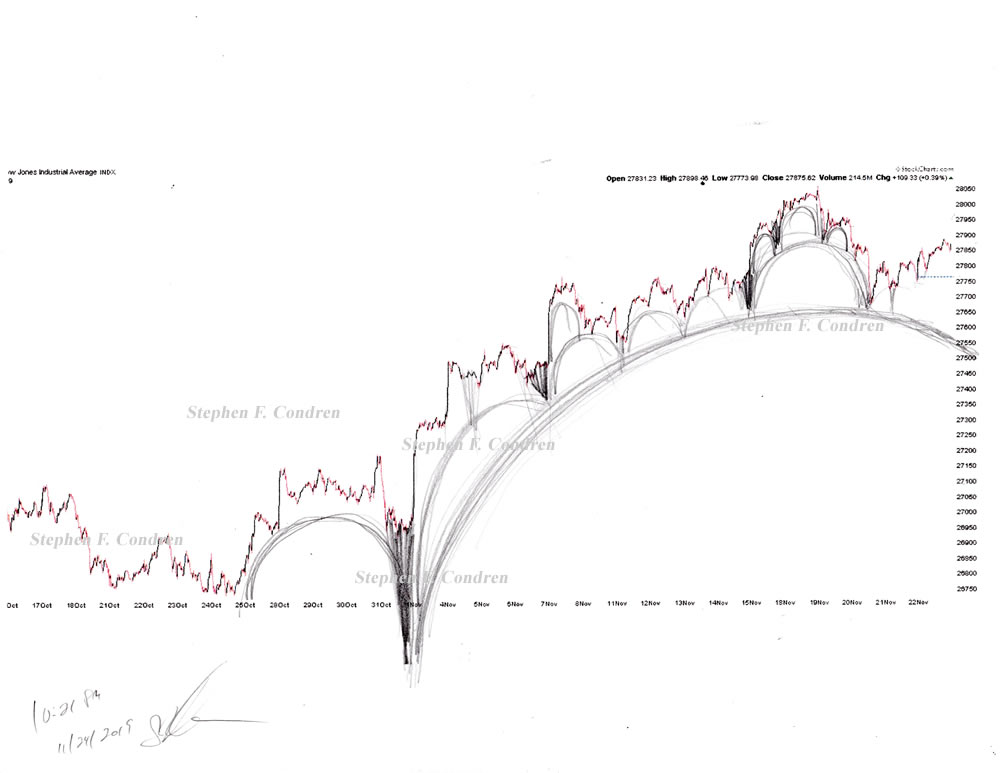
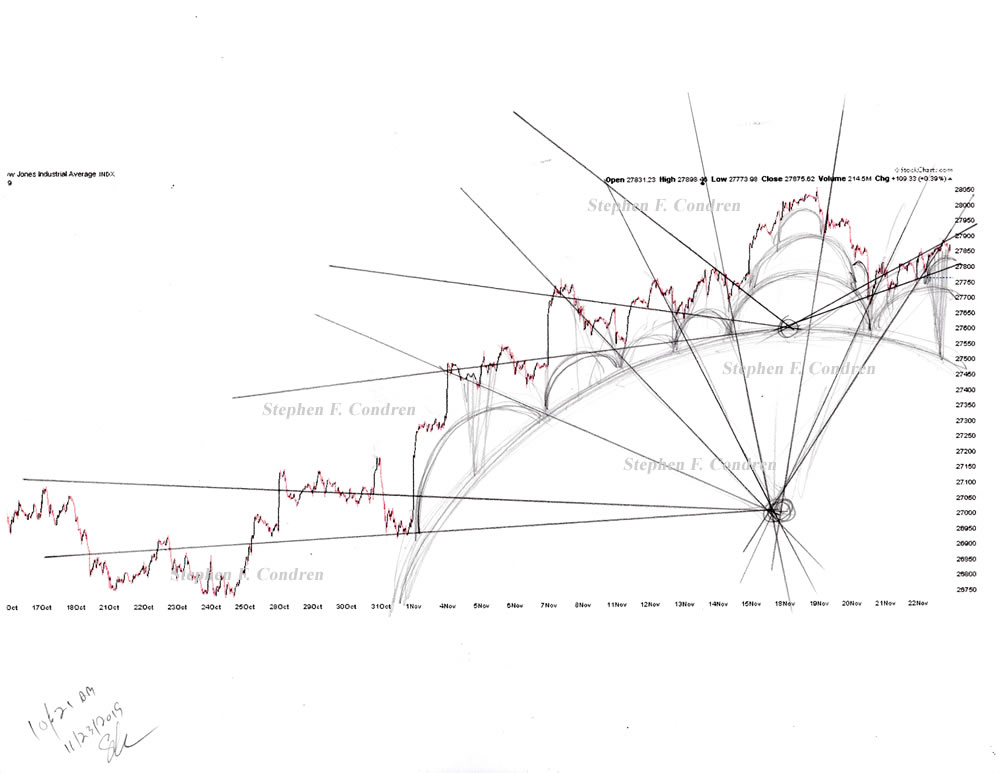
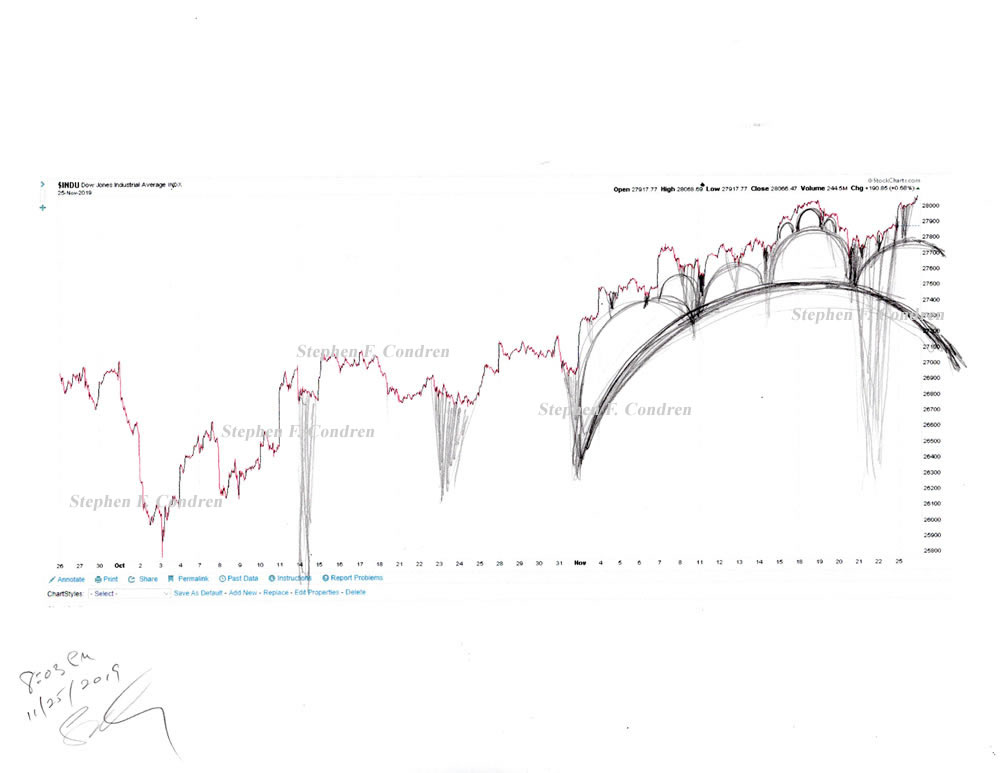
Above is my drawing for the movement of the stock market today, because it is Monday. As you can see by looking to the far right I have shown what is a large dome that marks the last phase of this larger dome, because it is at right side of the “cantilever”. A new bubble was created on the 20th, and when the codes hit it on the 25th the stock market rallied up to climb over it.

Pencil Rendering

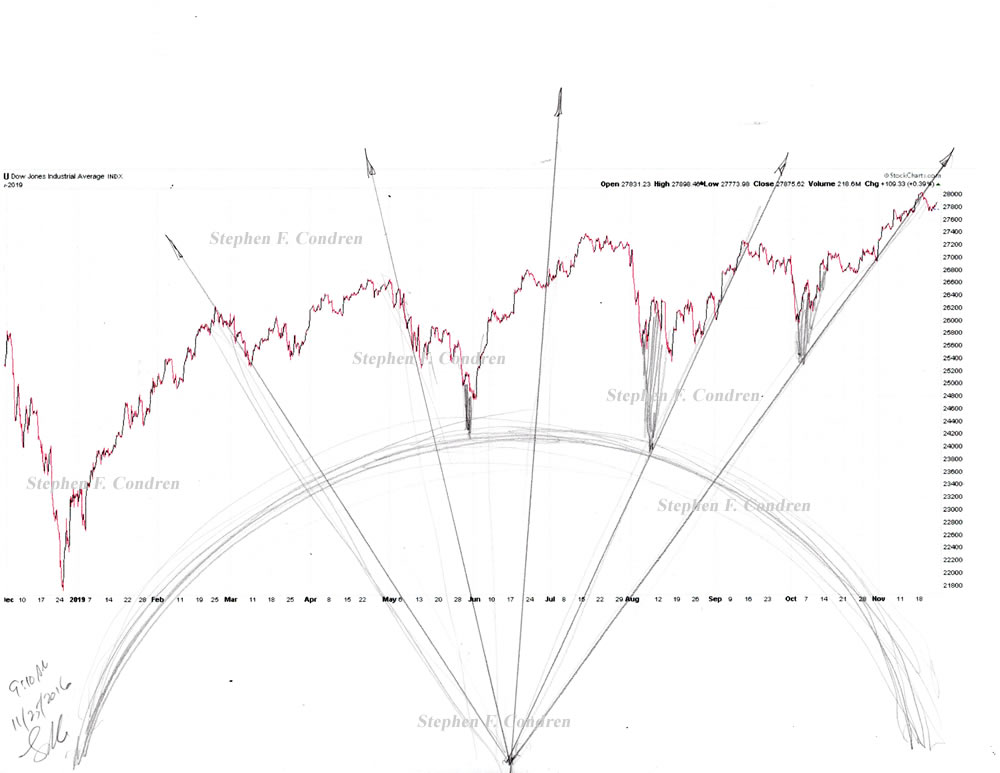
My rendering shows the theoretical bubbles that make up the structure of the stock market. There are of course many variations that can be made to this, so I do my best to offer what I think is the most accurate.

Meta Description

Stock market architecture #609Z or stock market analysis, pencil rendering by artist Stephen F. Condren with prints & scans.

Alt Image Tag

Stock market architecture #609Z or stock market analysis, by artist Stephen F. Condren.

Image Location

Prints, StockMarket, Dome Architecture, 11/25/2019

Credits

The charts that are used are from StockCharts.com, with may thanks.

Stephen F. Condren ~ Artist

Related Links

Stock Market Architecture #608Z

Posted on

Stock Market Architecture #608Z

Pencil drawing of stock market chart analysis by artist Stephen F. Condren.

Stock market architecture #608Z or stock market analysis, pencil rendering charts that forecast the direction of the stock market by artist Stephen F. Condren, of Condren Galleries, with prints, and scans. Prints & Scans Of This Drawing #608Z ~ Order Here.

Posted on Google+, Facebook, Twitter, Linked-in, and Tumblr.

Stock Market Architecture

Stock Market Analysis

This is my drawing of the Dow Jones Industrial average, because I want to demonstrate my theory. It is my thinking that all of the market is processed organically, because, like electricity, and wave theory it is of Science, and nature. The dates on the drawing are clearly marked.

Pencil Rendering

In my rendering above you can see the bubbles that make up the structure of the Stock Market Architecture. The bubbles are the structure that are moved by the codes, like the pattern of an oak leaf, because it is all organic. In my rendering below you can see the rays that for the Dome Architecture, because the rays are the agent that align the bubbles to the specifications of the code.

Rays

Rays are crucial in understanding Dome Architecture, because the angle of the ray from the core shows which side of the bubble that you are one. If you look to the far right, and see the activity of the last few days, you can see that the supporting rays aligned downward to the left, bending to the care, thus this is the construction of the cantilever to make the necessary drop that is coming for the completion of this dome.

Pencil drawing of stock market chart analysis by artist Stephen F. Condren.

Bubbles

Like bubbles making the foam at the top of a glass of beer, because they are a solid structure. So too, the structure of the bubbles secures the electrical impulses that make the charts. It is important to note that the bubbles are used to create the stock market charts are really domes, because they are not round. They need to form an arch to build a stable foundation for the architecture. Whereas, bubbles like those in a glass of beer are not stable but fluid, so they are round.

Photo of beer bubbles for Stock Market Architecture.

Meta Description

Stock market architecture #608Z or stock market analysis, pencil rendering by artist Stephen F. Condren with prints, and scans.

Alt Image Tag

Stock market architecture #608Z or stock market analysis, by artist Stephen F. Condren.

Image Location

Prints, StockMarket, Dome Architecture, 11/22/2019

Credits

The charts that are used are from StockCharts.com, with may thanks.

Stephen F. Condren ~ Artist

Related Links

Code Theory #456Z