
Code Theory #546Z or Dome Architecture, pencil drawing of stock market charts, and how their patterns are formed from codes by artist Stephen F. Condren, of Condren Galleries, with prints, and scans. Prints & Scans Of This Portrait #546Z ~ Order Here.
Posted on Google+, Facebook, Twitter, Linked-in, and Tumblr.
Code Theory
Dome Architecture
This is a long and complicated topic, of which I only wish to touch the very surface of, because it requires more space than permitted here. Code Theory is my analysis of patterns of the stock market that are genetically pre-coded much like DNA. Dome Architecture is the Geometry that shows this theory.
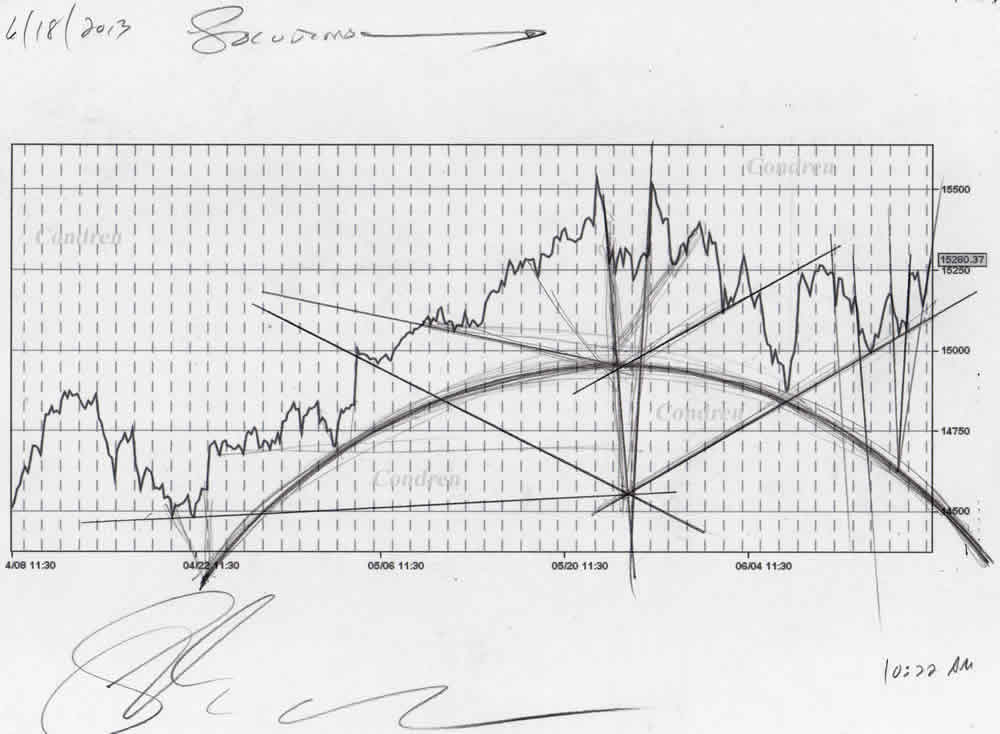
Pencil Drawing Of Stock Market Charts
Above is a simple drawing of Dome Architecture, because the dome is the central block of the drawing. If you look at the “center” of the dome, lines come out from the center past the surface of the dome, because they are rays. On the left side of the dome, all of the ray are sloping to the center, because they are going up the dome. The right side rays are also pointing to the center, but all are aligned to the left, because they are going down the dome. Thus you can see from Dome Architecture how the patterns are aligned, because this shows them going up or down.
The mountain like code pattern that you see on the far left of the drawing, during the first hour of trading, is the “Devil’s Tower” code. Variations of this pattern can be seen in the processing of the market, because all elements need a code, or pattern to process their movements.
Drawings With Prints & Scans
Alt Image Tag
Code Theory #546Z or Dome Architecture, pencil drawing of stock market charts, and how their patterns are formed from codes by artist Stephen F. Condren with prints, and scans.