
Stock market forecast #674Z or stock market architecture charts, pencil rendering by artist Stephen F. Condren, of Condren Galleries, with prints, and scans predicting future stock market moves. Prints & Scans Of This Drawing #674Z ~ Order Here.
Posted on Google, Facebook, Twitter, Linked-in, and Tumblr.
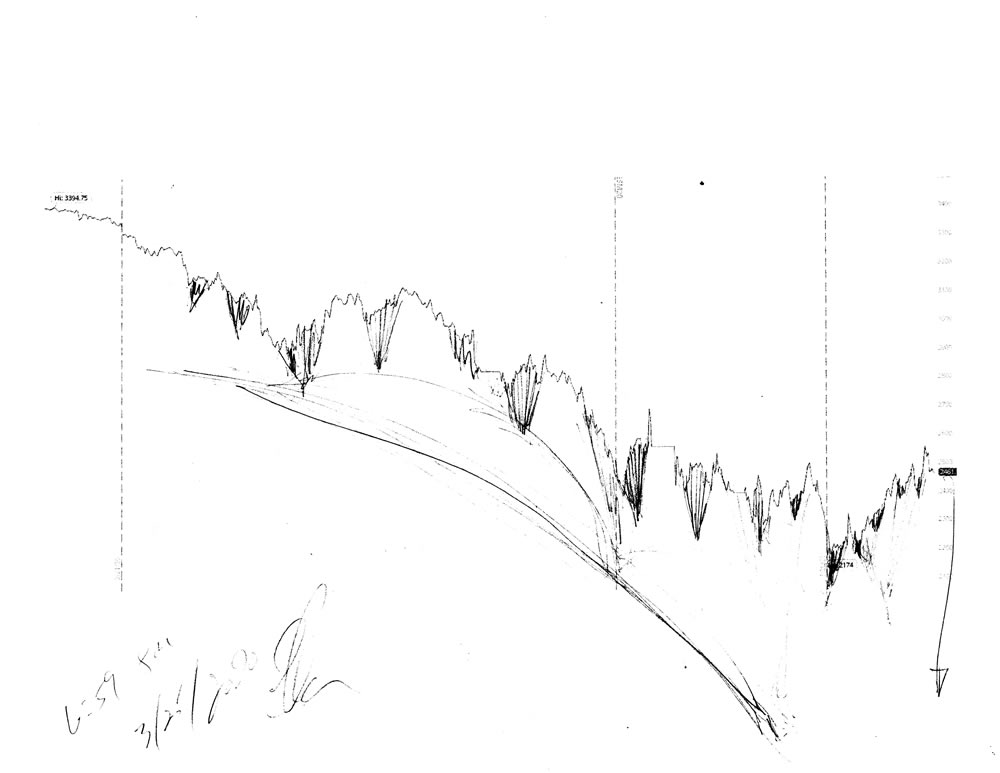
Stock Market Architecture
Forecast 1/4//2020
Stock Market Analysis
As you can see from my chart above the stock market is headed straight down, because this is demanded by the codes that form it’s path. The area between March 12th & 20th is a cap (a bubble that cover a deep fissure), which can be seen by the alignment of the rays that meet way down below the 17th of March.
Pencil Rendering
The rendering give a good perspective of how the bubbles, or domes are set upon each other to form the structure that we call the stock market.
Meta Description
Stock market forecast #674Z or stock market architecture charts, pencil rendering by artist Stephen F. Condren with prints & scans predicting future moves.
Alt Image Tag
Stock market forecast #674Z charts by artist Stephen F. Condren.
Image Location
Prints, StockMarket, Dome Architecture, Date
Credits
The charts that are used are from Charles Schwab, with many thanks.
Stephen F. Condren ~ Artist
Related Links
Stock Market Forecast #673Z