
Stock market forecast #675Z or stock market architecture charts, pencil rendering by artist Stephen F. Condren, of Condren Galleries, with prints, and scans predicting future stock market moves. Prints & Scans Of This Drawing #675Z ~ Order Here.
Posted on Google, Facebook, Twitter, Linked-in, and Tumblr.
Stock Market Forecast Video
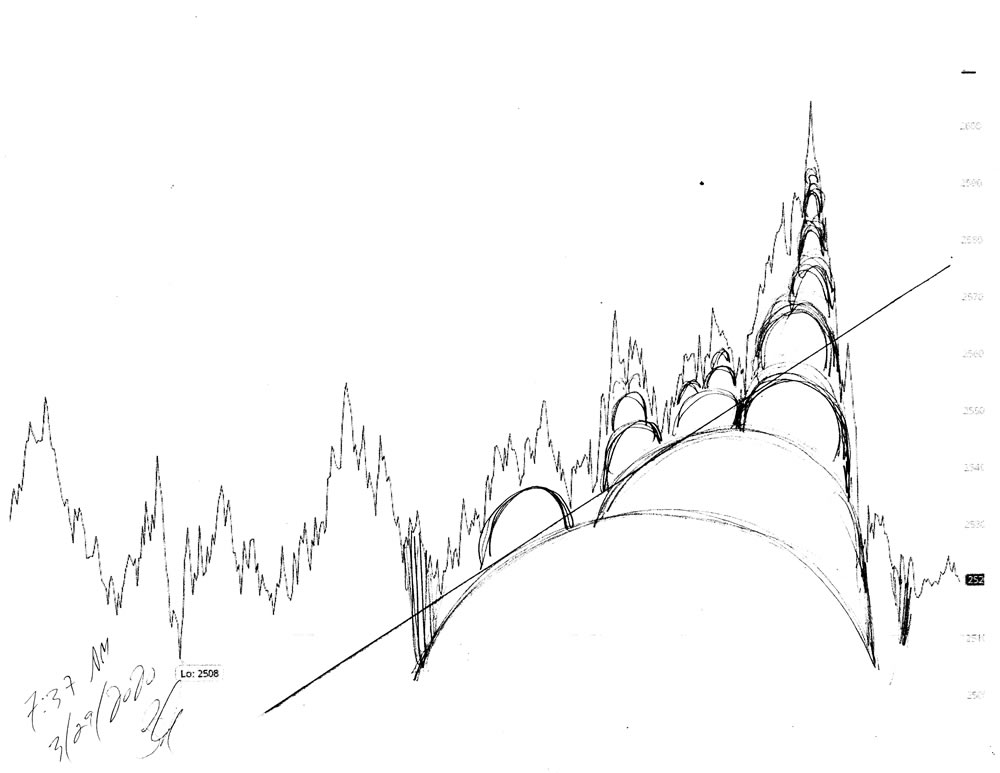
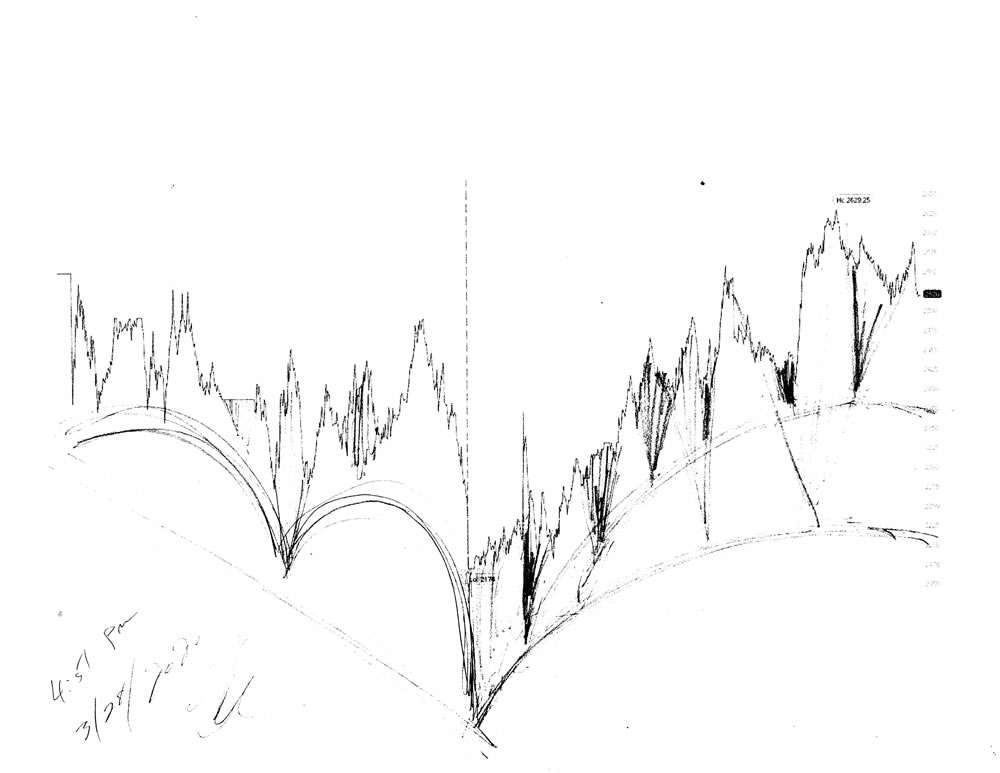
As you can see from my drawing above we are a the top of the bubble that will carry the stock market over, and down to the next echelon, because the stock market is going very far down.
My prophetic video above clearly shows that my Science of Dome Architecture is correct, because it is based on fact.
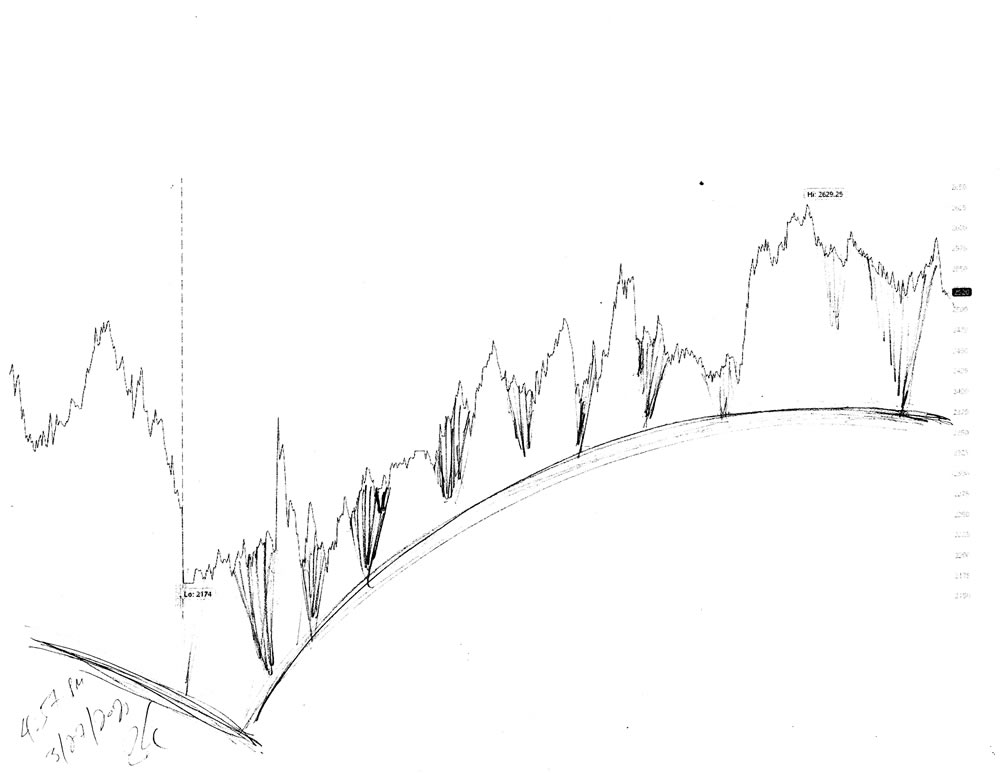
Detail Of Dome Architecture
Above is a detail of the last half of the trading day on March 27, 2020. This drawing clearly show how dome architecture supports the stock market, and how rays align the dome or bubbles to form the codes. This last part of the trading day ominously shows the same code for the stock market since 2008, all of which I have predicted, and have posted online.
Rays
The Rays Will Save You
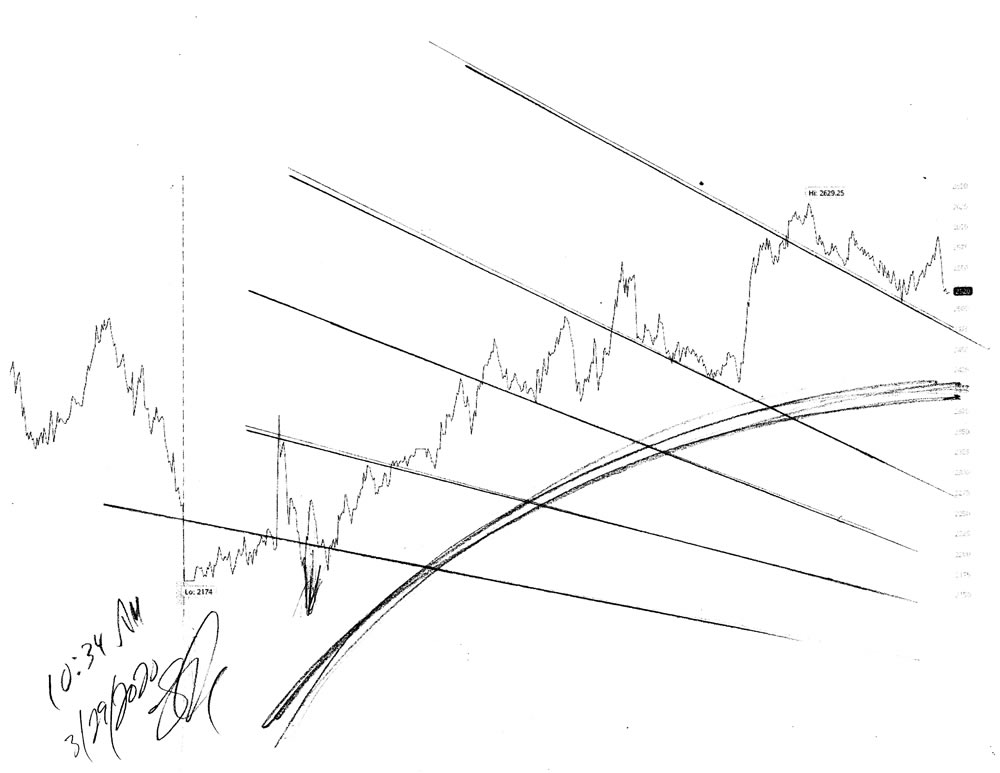
From my chart above you can see the array of rays all bending down to the right. This is because they are aiming at the core, or center of the regional dome. Because the rays are pointing to the right this means that we are climbing up the dome, and are now at the top. Thus, most probably there bill be a series of smaller bubbles forming a finial like the chart directly above this one. My famous phrase is: The rays will save you.
Pencil Renderings
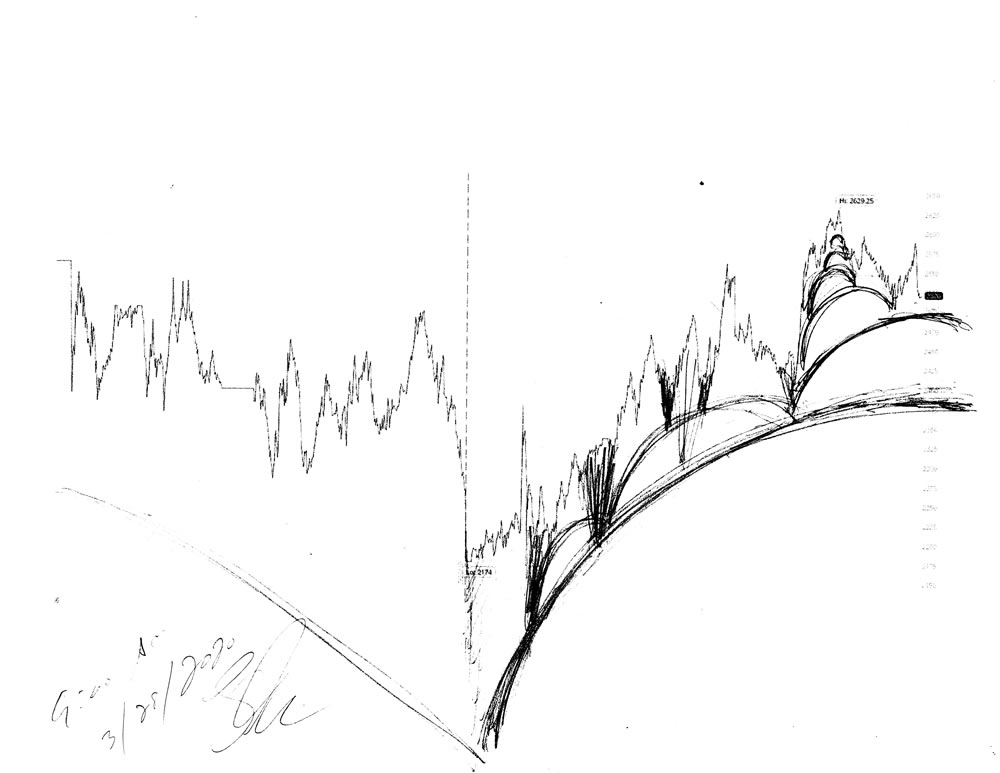
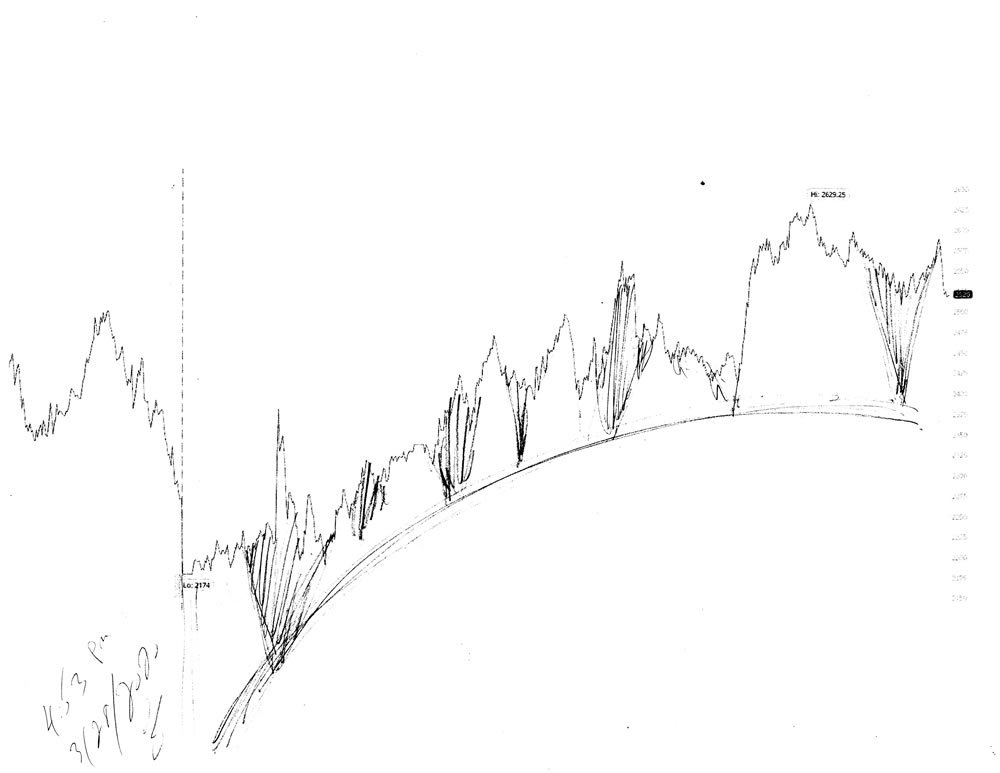
In my renderings above are other variations on the same theme. You can see that the footers clearly denote the curve of the current bubble, because they give the path of the arch.
Shorting The Stock Market
In my thinking that in general it is best to short the market, because you are given a history to work with. Thus, in today’s rendering I can look at the chart and calculate that it is best to short the market on Monday or Tuesday, depending on how the codes of the market are formed over the weekend. It is very difficult to go long on the market because no chart has been created yet, sort of like going into uncharted waters.
2.2 Trillion Dollar Stimulus Law
This paragraph is written at 3:10 PM, on 3/28/2020. With the passing into law the titanic stimulus package it stands to reason that the stock market will rally substantially in the Sunday evening futures markets, and on Monday morning at the opening bell.
FOMC
However, like the FOMC announcement of last December that set the stock market on a 3,000 point rally for three months, this stimulus package will eventually be absorbed, and the stock market will again continue it’s path downward.
Meta Description
Stock market forecast #675Z or stock market architecture charts, pencil rendering by artist Stephen F. Condren with prints & scans predicting future moves. I am predicting that the stock market will go down another 10,000 points.
Alt Image Tag
Stock market forecast #675Z charts by artist Stephen F. Condren.
Image Location
Prints, StockMarket, Dome Architecture, Date
Credits
The charts that are used are from Charles Schwab, with many thanks.
Stephen F. Condren ~ Artist
Related Links
Stock Market Forecast #674Z