
Stock market forecast #681Z or stock market architecture charts, pencil rendering by artist Stephen F. Condren, of Condren Galleries, with prints, and scans predicting future stock market moves. Prints & Scans Of This Drawing #681Z ~ Order Here.
Posted on Google, Facebook, Twitter, Linked-in, and Tumblr.
Stock Market Forecast Video
Stock Market Analysis
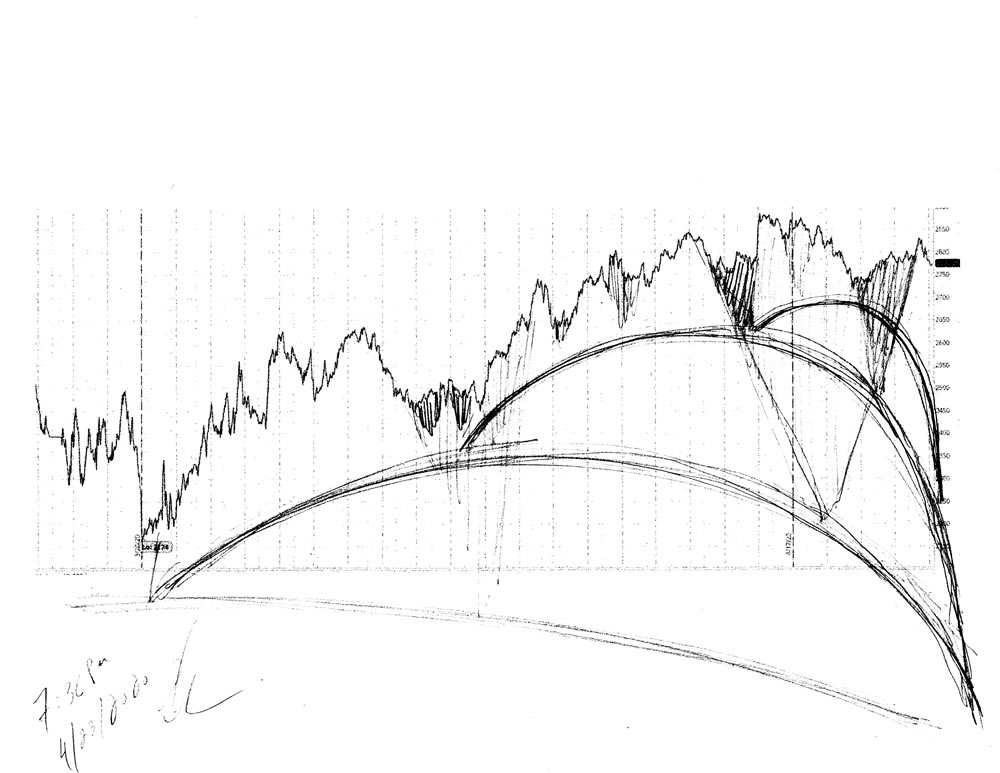
In my chart above you can see that we are near the top of this region, and preparing to head downward, because this is demanded by the codes. A key understanding of Dome Architecture is the formation of patterns, and how to recognize them.
Pencil Rendering
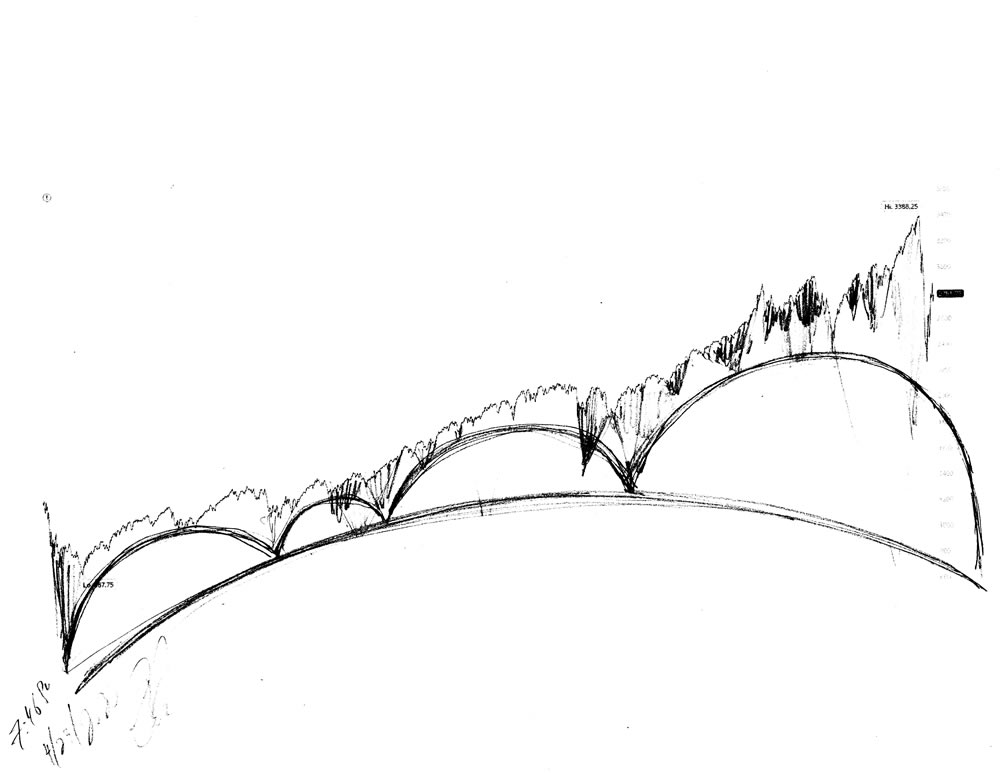
In my rendering below you can see an overall view of the market for more than a decade, because this offers a view of how the domes are aligned. The domes are a cluster of bubbles that are mounted upon each other, much like that of a soap dish. In this rendering you can see how the largest dome is commenced at the crash of 2008.
Meta Description
Stock market forecast #681Z or stock market architecture charts, pencil rendering by artist Stephen F. Condren with prints & scans predicting future moves.
Alt Image Tag
Stock market forecast #681Z charts by artist Stephen F. Condren.
Image Location
Prints, StockMarket, Dome Architecture, Date
Credits
The charts that are used are from ThinkOrSwim with many thanks.
Stephen F. Condren ~ Artist