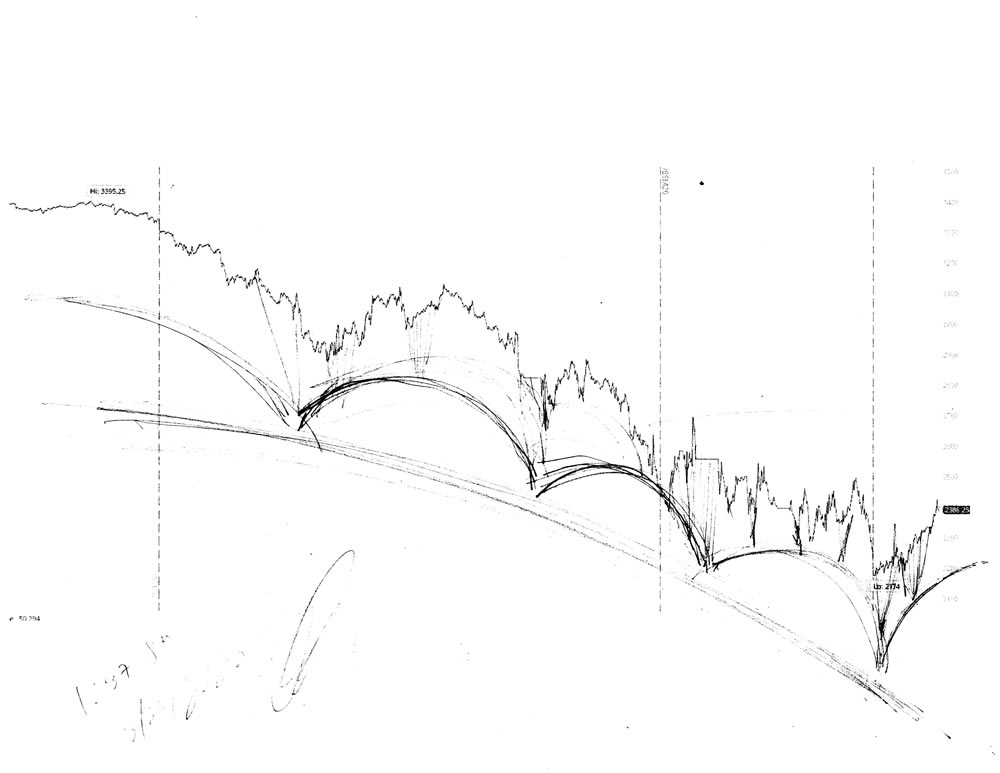
Stock market forecast #673Z or stock market architecture charts, pencil rendering by artist Stephen F. Condren, of CondrenGalleries, with prints, and scans predicting future stock market moves. Prints & Scans Of This Drawing #673Z ~ Order Here.
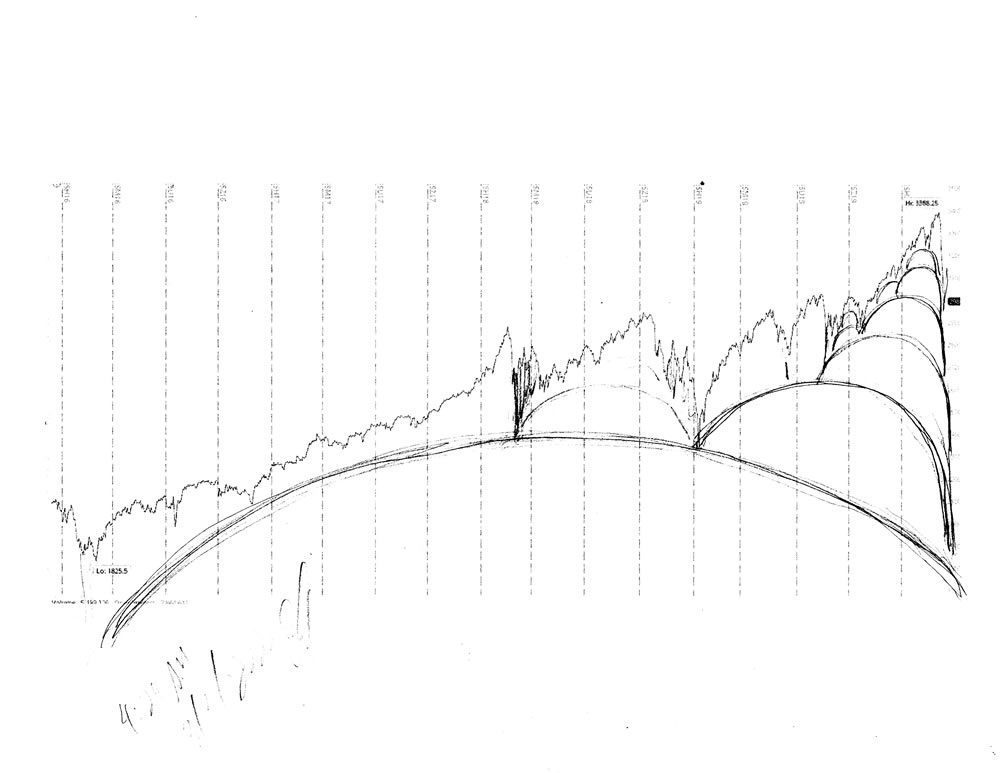
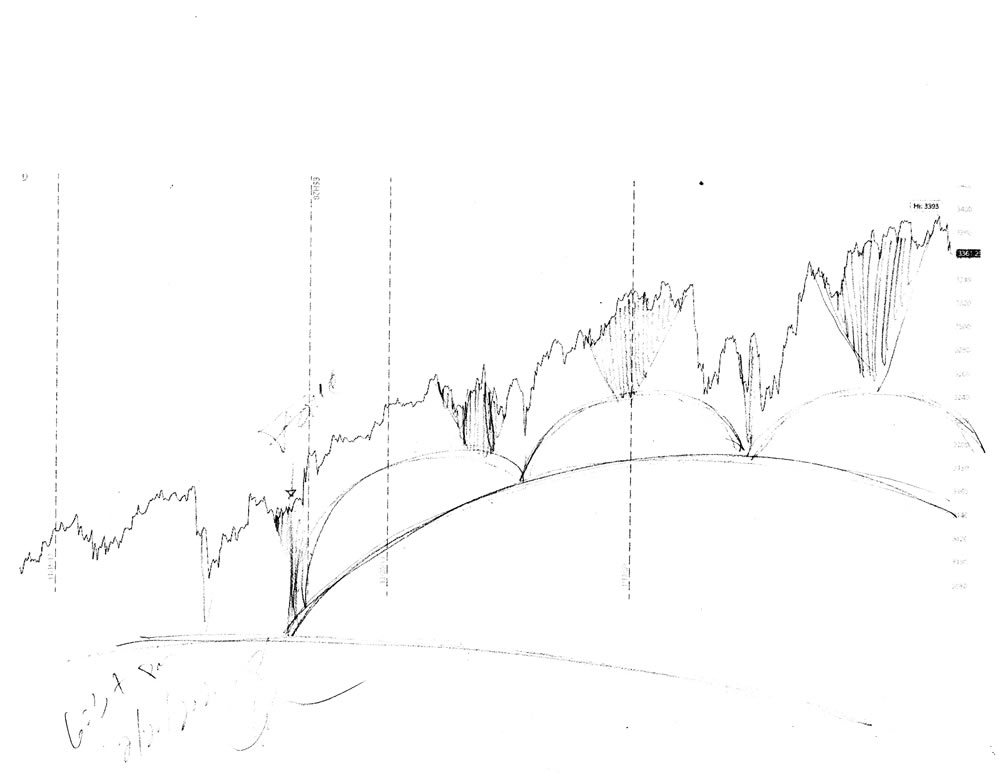
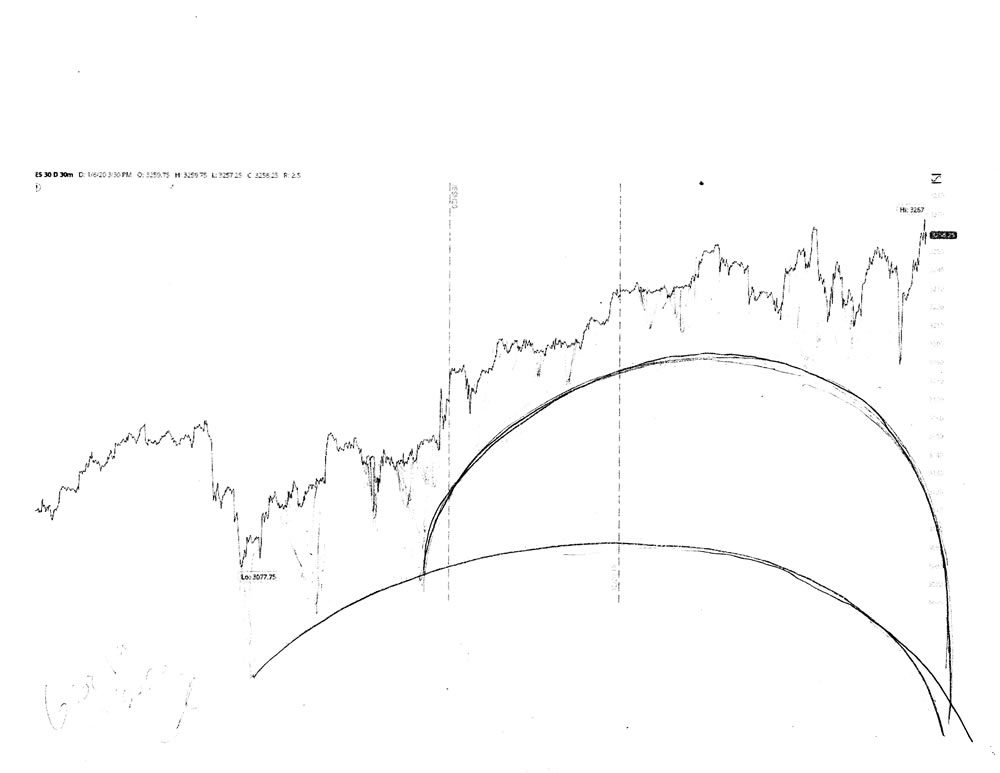
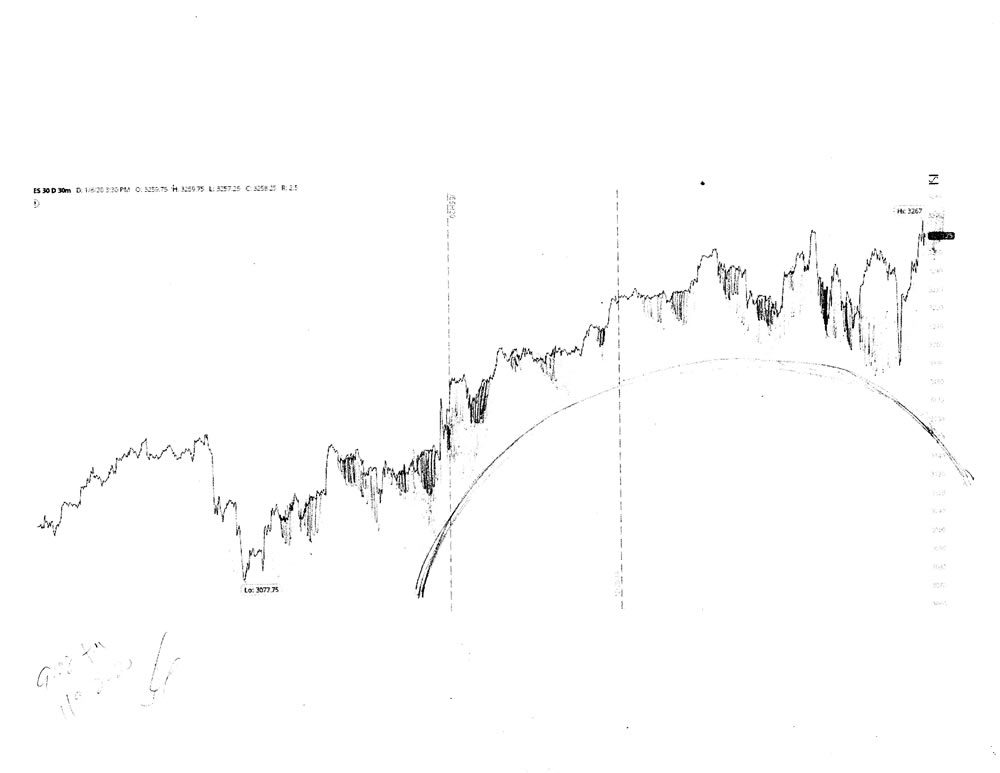
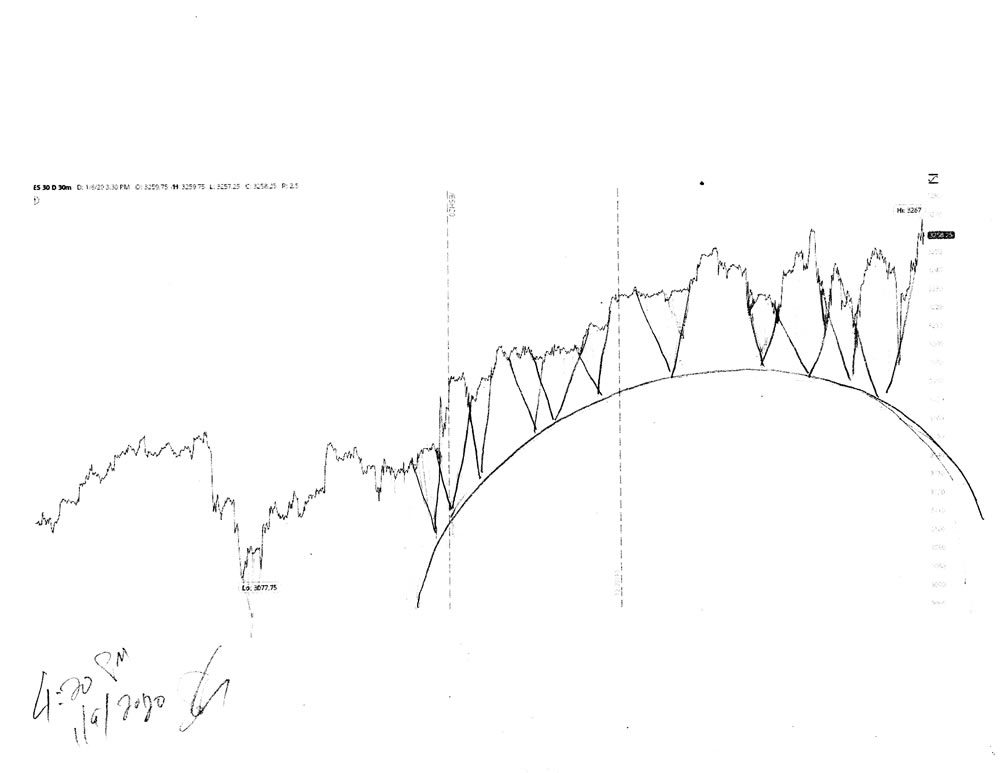
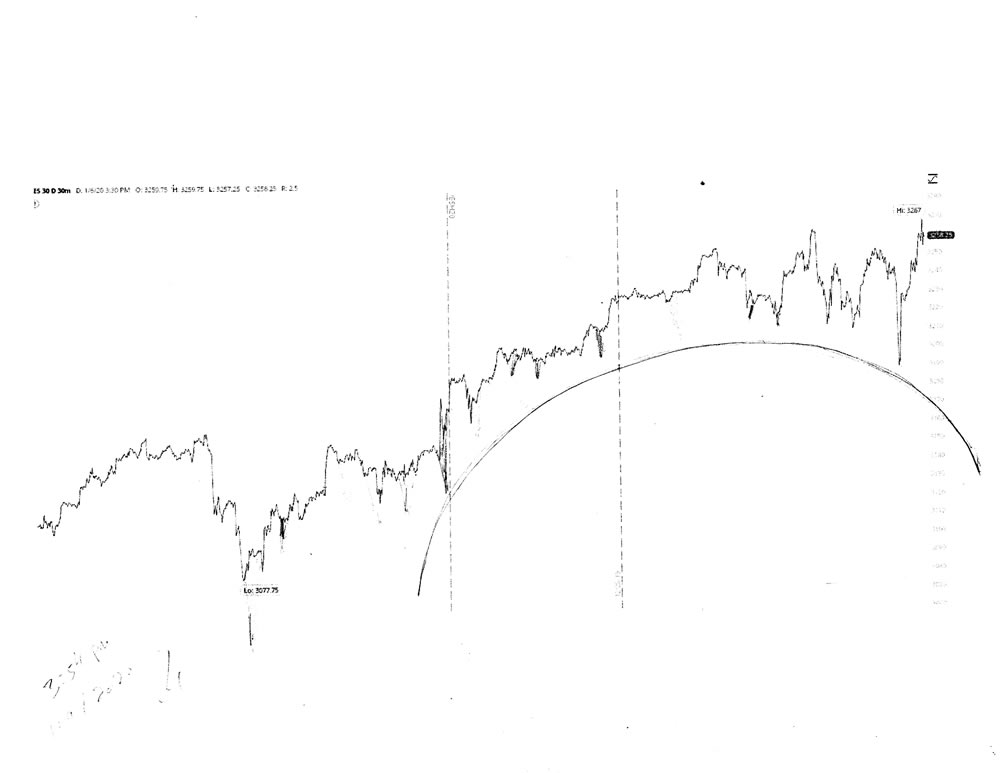
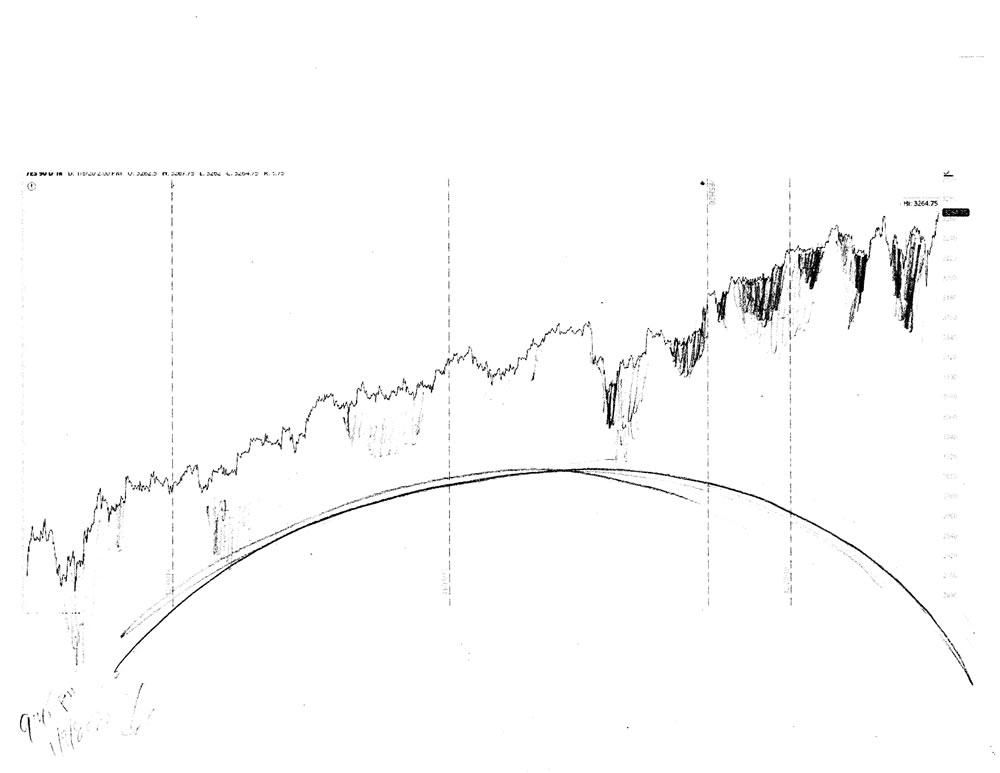
As you can see from my drawing above, the stock market has hit the larger dome of the next echelon below, because it is continuing to decline. It has now made a newer dome that will carry the market over a hump so as to jump down to the next echelon.
Pencil Rendering
Stock market forecast chart.
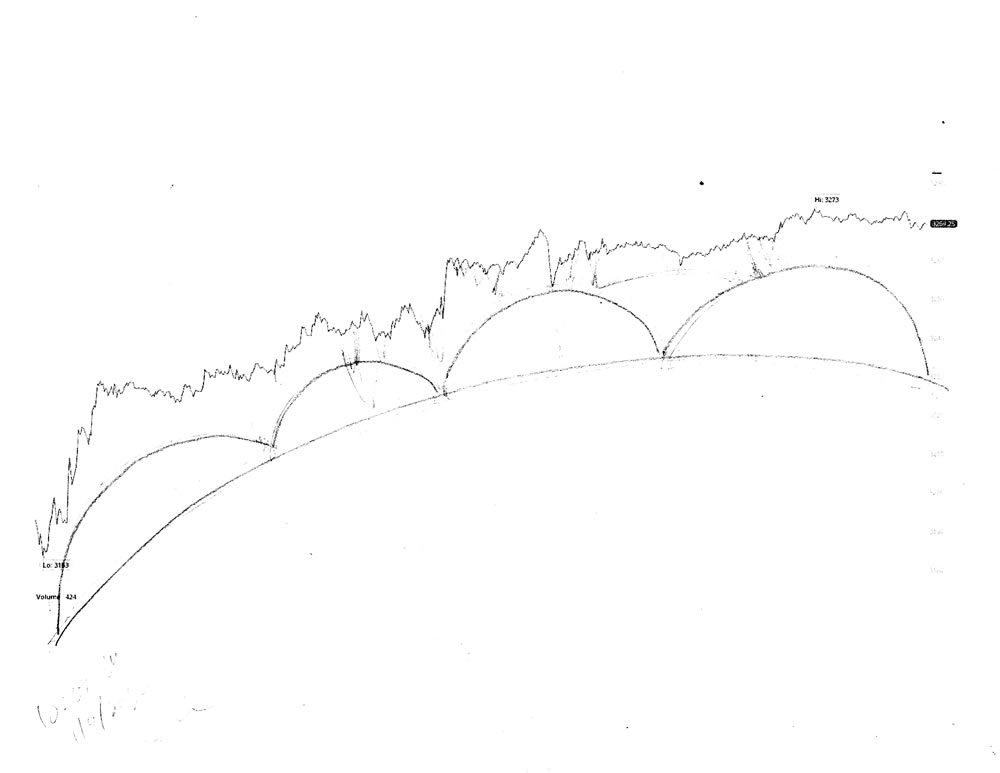
In my rendering above is a variation on my drawing at the top of the article. This has to be done because circuit breakers that the NYSE has put on the market at several intervals, thus disrupting the pattern of the codes, and making it all the more difficult to interpret a subject that is already difficult to start with! In this alternative rendering you can see the delineation of the newer bubble at the bottom right, and it is not complete, because it is still in formation. Much in the same manner as DNA, the actual code for the newer bubble is in place, but it is not made manifest until the market fulfills the code form.
It is very likely that there will be newer and smaller domes built upon this bubble causing a false hope of market gain, but in realty it is just like slinkies going down stairs.
Meta Description
Stock market forecast #673Z or stock market architecture charts, pencil rendering by artist Stephen F. Condren with prints & scans predicting future moves.
Alt Image Tag
Stock market forecast #673Z charts by artist Stephen F. Condren.
Image Location
Prints, StockMarket, Dome Architecture, Date
Credits
The charts that are used are from Charles Schwab, with many thanks.
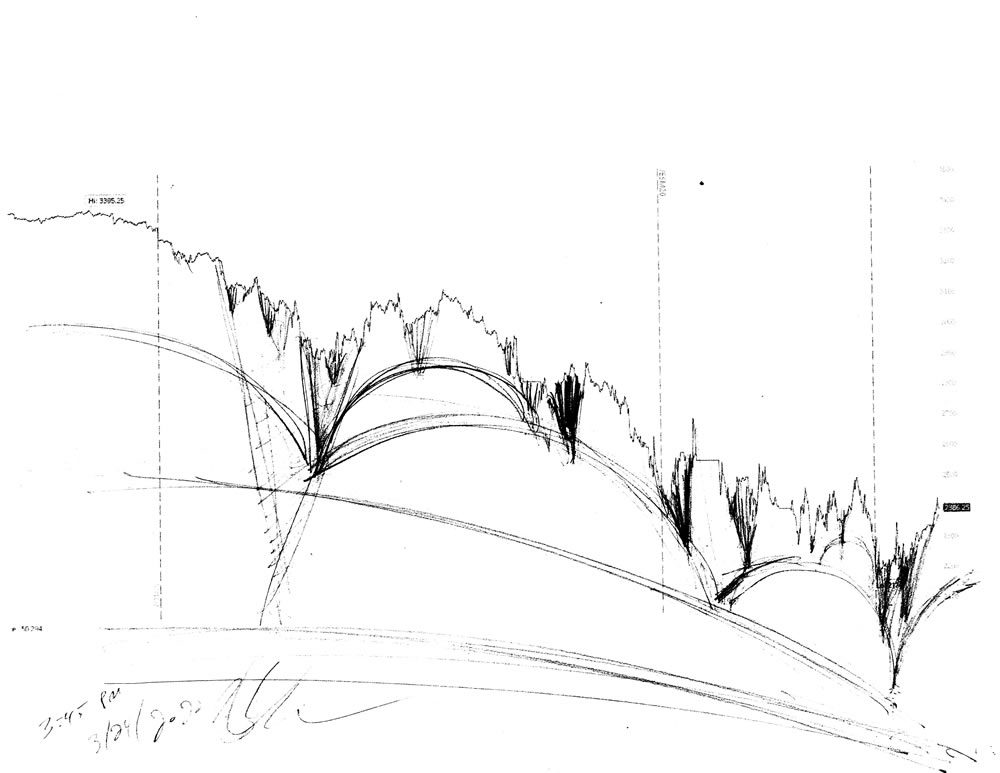
Stock market forecast #672Z or stock market architecture charts, pencil rendering by artist Stephen F. Condren, of CondrenGalleries, with prints, and scans predicting future stock market moves. Prints & Scans Of This Drawing #672Z ~ Order Here.
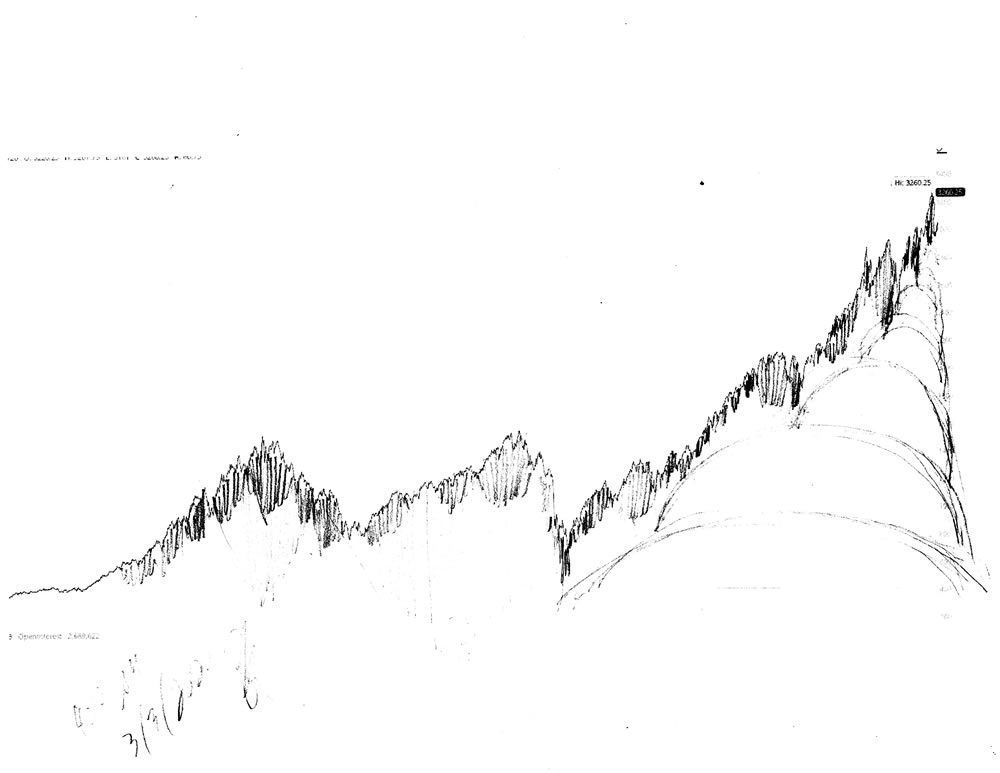
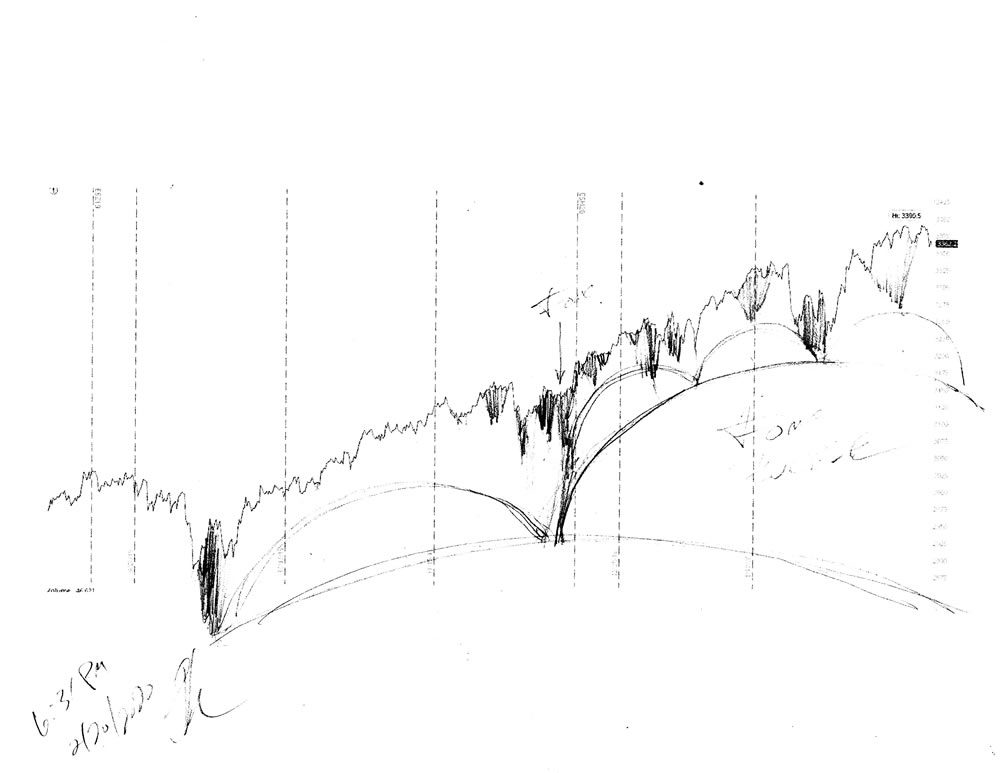
As you can see from my chart above the stock market, as I have predicted long before the crash, or Coronavirus, is heading down quickly. All of this is pure Physics, and the forces of nature with the use of good old gravity are bringing the market down, because the stock market is grow.
Stock Market Is Growing
Yes, the stock market is growing. The way that the stock market grows is with the creation of newer larger bubbles. It was the crash of 2008 from the pushing down of the previous bubble that made the newer, and large one that we have been riding for the past decade. This new decade, after this crash passes, will be far greater and stronger than any in history. However, for now, we have to work through the current decline that is making the newer and larger bubble.
Entitlement
Investors, or rather people that put money into the stock market, are not entitled, or guaranteed a profit on their money, because the stock market is a vehicle for equity transactions that can gain or lose in value. Just as a merchant that opens a new store with hopes of success, he or she has no guarantee.
Margin
To go from the frying pan into the fire just start using margin, and you will find yourself in more trouble, because you do not know the outcome of your stock positions, and no matter what you are paying interest on that money!
Pencil Rendering
Below you can see my rendering for the market for the past 26 years. The stock market will approach lower levels like that of 2008, but it will not last long.
Stock market forecast chart, 26 Years.
Meta Description
Stock market forecast #672Z or stock market architecture charts, pencil rendering by artist Stephen F. Condren with prints & scans predicting future moves.
Alt Image Tag
Stock market forecast #672Z charts by artist Stephen F. Condren.
Image Location
Prints, StockMarket, Dome Architecture, Date
Credits
The charts that are used are from Charles Schwab, with many thanks.
Stock market forecast #666Z or stock market architecture charts, pencil rendering by artist Stephen F. Condren, of CondrenGalleries, with prints, and scans predicting future stock market moves. Prints & Scans Of This Drawing #666Z ~ Order Here.
As you can see from my chart above the stock market is on path to it’s first major stop near the 2,100 level. This has been predicted in my previous posts. Because most people foolishly think that the stock market always goes up they hold on to their stock. People are wrongly told by financial advisors to just hold your stock (or portfolio) and wait it out, because the market always comes back.
The Stock Market Does Not Always Come Back
The stock market is a place to do business, and nothing more, because it is a market place, just like the food markets in town centers. There is no guarantee of any kind that the prices of fruits will always be the same, it all depends on the processing of the need, or demand for it. The stock market crash of 1929 took years to come back because it rallied so high. The same is true with our situation at hand, for this market is nothing but a finial and it will be years before it gets back to this altitude. If waiting years for your money to regain it’s value, then I am sorry to so you are not my kind of financial planner. It is best to cut your losses now, or continue down the road to financial ruin, especially those that are holding stocks on margin ~ they will be forced out.
Religion
I am not into religion, and I do not pray the rosary before the opening bell, for that is for fools. Rather, I put my faith in facts, and research, rather than the whims of hope, and faith, which are the makings of a religion. Religion at Wall Street is the same as building your house on the sands of the Sea of Gibber, just waiting to be washed away. Wall Street is not a place to pray, and hope, rather it is a place of executed negotiations that are based on research supported by facts.
Short The Stock Market
My advise is either to sell everything you have now, or just short the stock market. This market will go at least to the 12,000 level, and I am thinking that it will go lower than in 2008. For collapsing bubbles make new bubbles, and that is what happened in 2008. A large and vast bubble was created in 2008 and when the bubble hit the frequency of the this very heavy subwoofer it created a giant new wave that reached it’s peak 5 years ago, then the after-bubbles, which always stack up to the right make the vast finial that we are now leaving. In a nutshell we are riding the wave like a surfer, and getting ready to crash onto the shore.
Newer Greater Market
At the finish if this current collapse, a newer and greater market will arise, because the newer, larger bubble has already been made. This newer, larger bubble will drive the market far higher than it currently has been, because it will be stronger. However, it will be many years before the stock market returns to these high levels.
Dancing On The Titanic
Like fools dancing on the Titanic, investors rally to the stock market as a safe haven, because they do not know what else to do. I call these people fools because they are putting their precious, hard earned money into the hands of strangers. When you look for a college for your children you do a lot of legwork, so too with investing your money. I do not hand my money over to anyone, and I never will. I use my research, and only trust myself when it comes to handling my money.
Investment Banker ~ Vultures
It is a fact that investment bankers are paid most handsomely both by contract, and commissions on your money. Now, when the tail turns, and the market does not go to your favor, do these investment bankers (vultures) return to you your money, or slash their fees? No! These predators are paid by you no matter how the market goes and you are expected to trust them. Thus, they are in a win-win situation at your expense. I will not be the exponent for investment banker commissions.
Knowledge is power, and knowing and understanding what the stock market exactly is makes for sober understanding on the placement of monies. The stock market is no longer a viable place to hold cash because it is too volatile now because of it’s size and scale. The new scale creates vast swings in the market which make financial planning unstable.
Coronavirus & Donald Trump Tweets
The downside turn in the stock market has absolutely nothing to do whatsoever with the coronavirus, or any tweets by President Donald Trump, because the decline is based on the laws of Physics not the mood of the President.
2008 Financial Crisis
The downturn of the stock market in 2008 had nothing to do with housing, because again, it has to do with the organic processing of materials under the aegis of the laws of physics. When the market turns down the media, and the press look around for a reason that they can label as the problem, like a whipping boy. The fact of the matter is that the movement of the stock market is based on the motions of the processing of material, and this is done through sine waves.
Pencil Rendering
The entire market is held up by domes or bubble on a soap dish, and there is nothing stronger than a bubble. The sun and all the planet are bubbles and what is stronger? In the case of the sock market it, the elevations are upheld by the half-dome, like bubbles on a soap dish, because like mountains made of magma, this is a substantive material and needs to be processed accordingly.
Stock market forecast chart pencil drawing by artist Stephen F. Condren.Stock market forecast chart pencil drawing by artist Stephen F. Condren.Stock market forecast chart pencil drawing by artist Stephen F. Condren.Stock market forecast chart pencil drawing by artist Stephen F. Condren.
Rule Of Nature
The processing of materials no matter what they may be, (lava, water, social customs, traffic flow, political correctness, or trading activity) are subject to the laws of Physics, which is organic, and the rule of Nature. For all of these elements abide by the laws of Physics, which are governed by the rule of Nature. The dome is the strongest and most capacious form in Nature, which can be see from gasses, and material objects. All elements pay homage to the bubble, especially the stock market.
Stock Market Forecast #666Z
I predict that the stock market will take a sharp decline this coming year and shall then continue to decline until it gets to the 12,000 level or even 7,000. Further, I predict that after the market reaches it’s lowest point, it will then turn around and rally higher, and stronger than it ever has, far surpassing this market that we are now leaving. The purpose of this rapid and hard decline is to create a mammoth bubble that will support the next coming market. Bubbles, both large and small, are all made from the decline of a previous bubble.
Meta Description
Stock market forecast #666Z or stock market architecture charts, pencil rendering by artist Stephen F. Condren with prints & scans predicting future moves.
Alt Image Tag
Stock market forecast #666Z charts by artist Stephen F. Condren.
Image Location
Prints, StockMarket, Dome Architecture, Date
Credits
The charts that are used are from Charles Schwab, with many thanks.
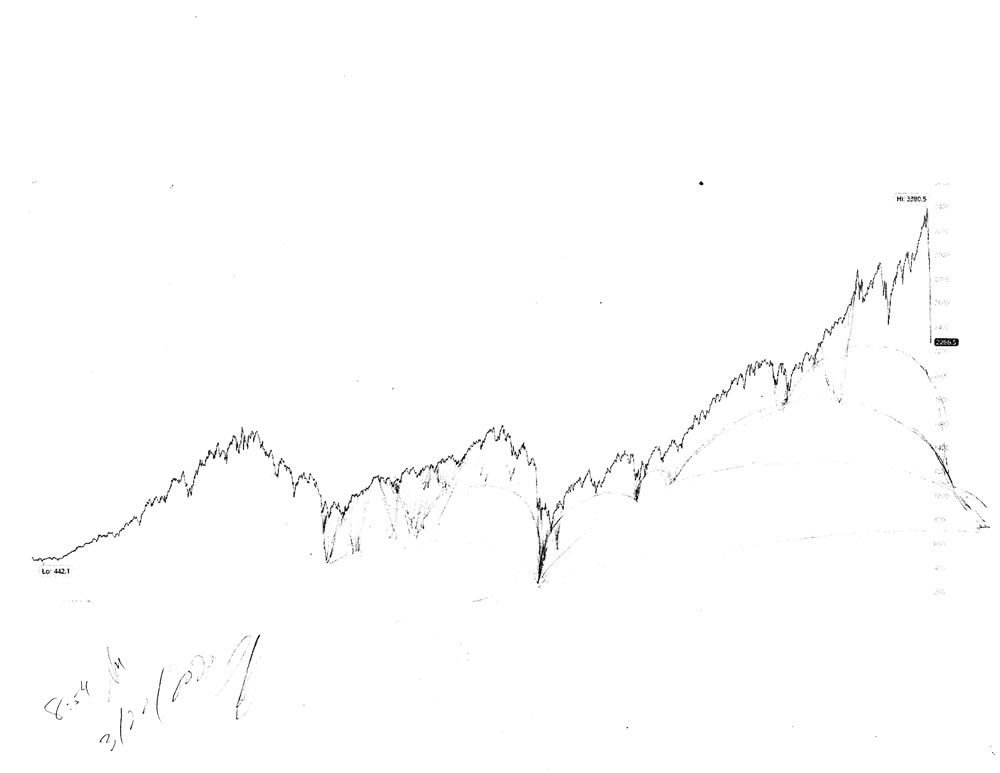
Stock market forecast #664Z or stock market architecture charts, pencil rendering by artist Stephen F. Condren, of CondrenGalleries, with prints, and scans predicting future stock market moves. Prints & Scans Of This Drawing #664Z ~ Order Here.
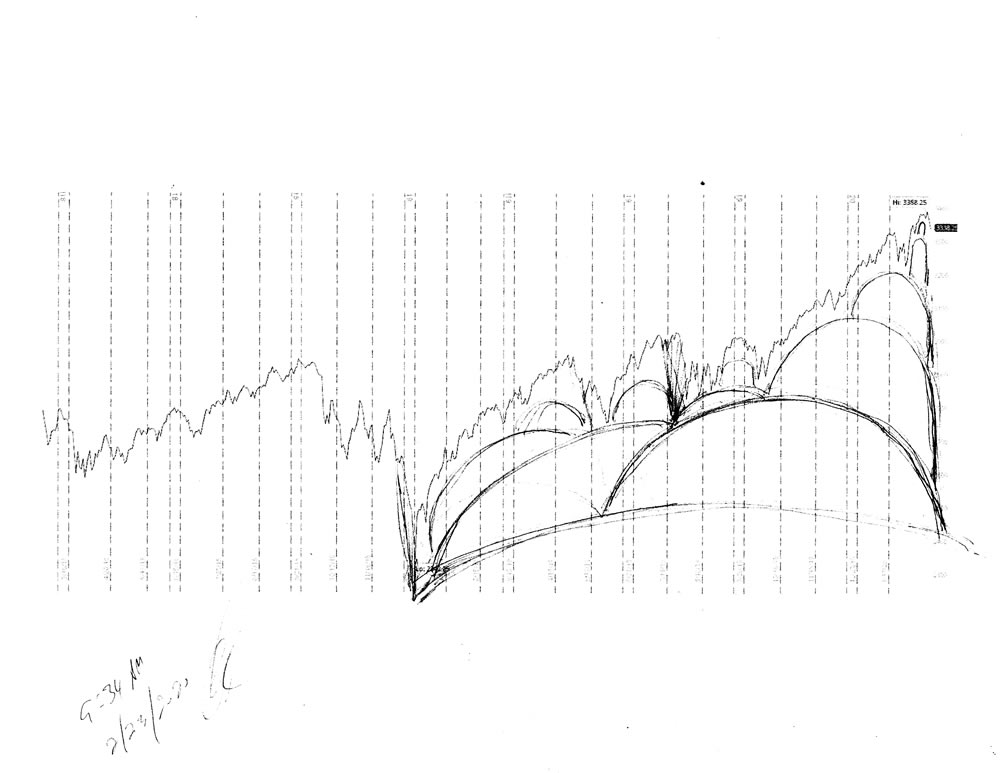
As you can see from my chart above for a period of over a year, the stock market has reached it’s peak, because it is at the top of a series of domes that make this very high point. It must be understood that since we are dealing with Science, and the laws of Physics, because everything about the stock market movement is organic, all the domes must be seen.
Domes
In other words, each and every bubble that is made had to be seen to completion. So in the case before us every dome that has been created up to this very high point has to be exposed on the down side, to show that it was a dome. All domes made must be seen.
FOMC
The market is now nearing the end of processing out the FOMC bubble created last December, because it does not belong here, it is just on over-sized wart that needs to be removed.
Pencil Rendering
If you look carefully at the rendering you can see all of the footers that make the domes, that the stock market climes to attain it’s height. Now that we are on the decline the images of the domes will be similar to slinkies going down stairs. This is because it is all about physics, and organic natural activity in the processing of material. Since stock market analysists are not artist or physicists they are not able to understand this. They only think in terms of quarterly reports and interest rates. The person to understand the stock market is the artist, because he can see the patterns of the codes, like those of the oak leave, and the movement of the sine waves.
Meta Description
Stock market forecast #664Z or stock market architecture charts, pencil rendering by artist Stephen F. Condren with prints & scans predicting future moves.
Alt Image Tag
Stock market forecast #664Z charts by artist Stephen F. Condren.
Image Location
Prints, StockMarket, Dome Architecture, 2/21/2020
Credits
The charts that are used are from Charles Schwab, with many thanks.
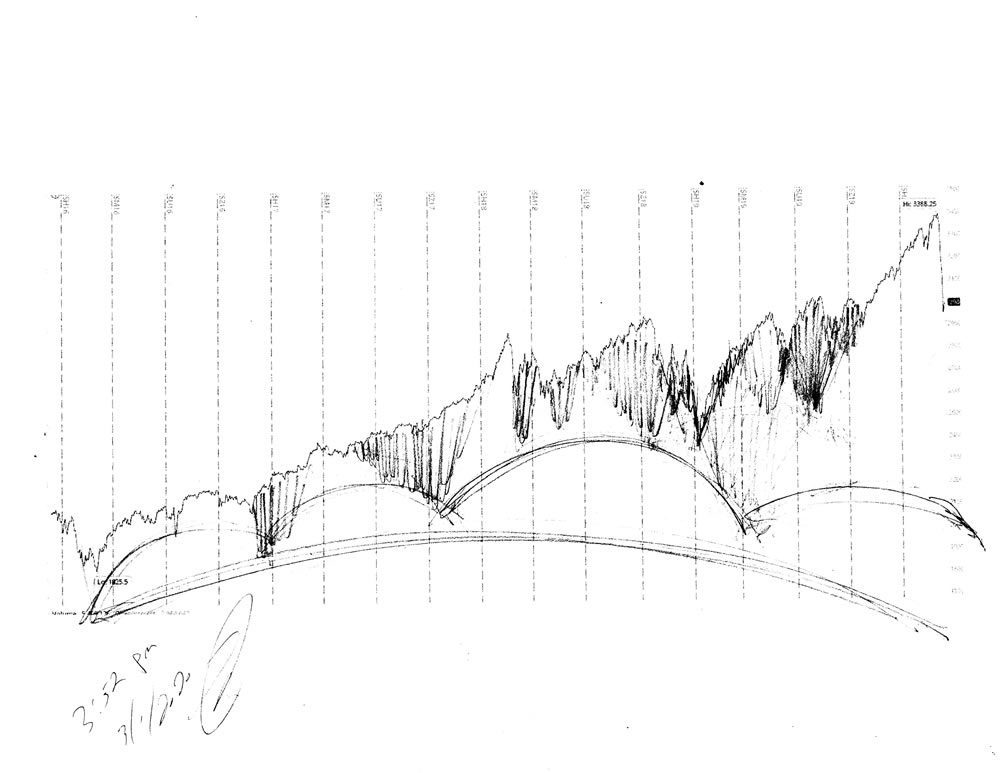
Stock market forecast #663Z or stock market architecture charts, pencil rendering by artist Stephen F. Condren, of CondrenGalleries, with prints, and scans predicting future stock market moves. Prints & Scans Of This Drawing #663Z ~ Order Here.
In my chart that I have displayed above, you can see my theory for the up and coming decline in the current stock market, because it is based on domes that are completed.
This dome was created by the FOMC last December, and it has taken all of this time to process it out.
Pencil Rendering
When you look at my rendering you will see that it shows the progression of bubbles that from the architecture of the Dow Jones landscape. The market is processing material, and operates like all elements of nature by using sine waves to move the product, be it water, oil, or commodities.
Meta Description
Stock market forecast #663Z or stock market architecture charts, pencil rendering by artist Stephen F. Condren with prints & scans predicting future moves.
Alt Image Tag
Stock market forecast #663Z charts by artist Stephen F. Condren.
Image Location
Prints, Stock Market, 2020, February, 2/21/2020
Credits
The charts that are used are from Charles Schwab, with many thanks.
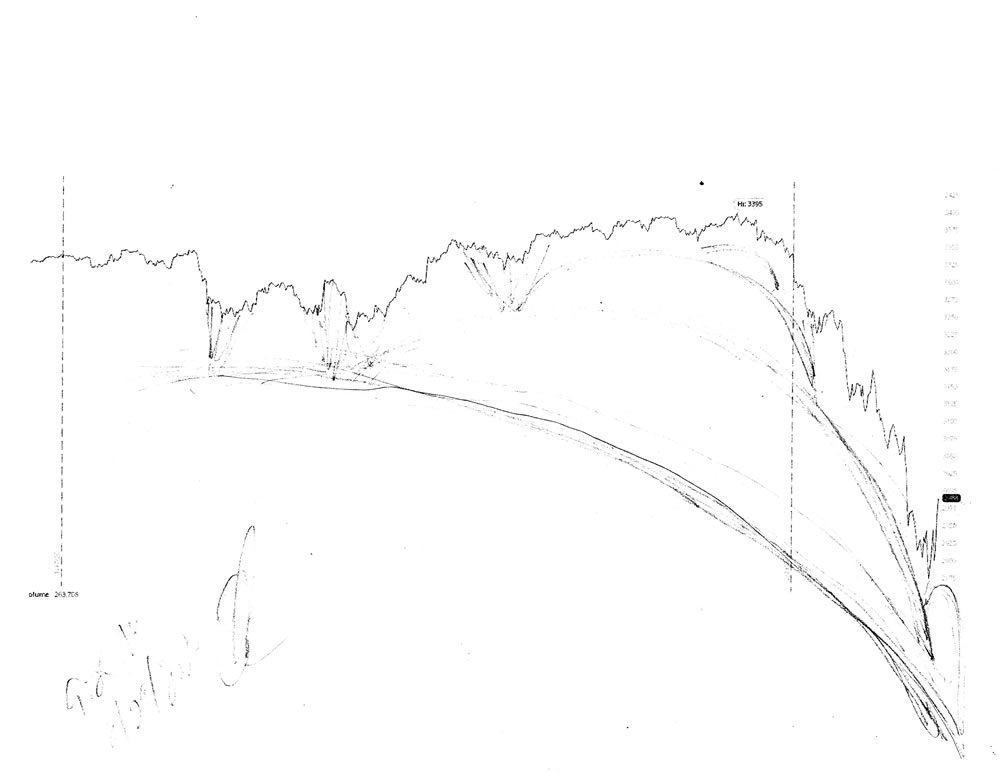
Stock market forecast #662Z or stock market architecture charts, pencil rendering by artist Stephen F. Condren, of CondrenGalleries, with prints, and scans predicting future stock market moves. Prints & Scans Of This Drawing #662Z ~ Order Here.
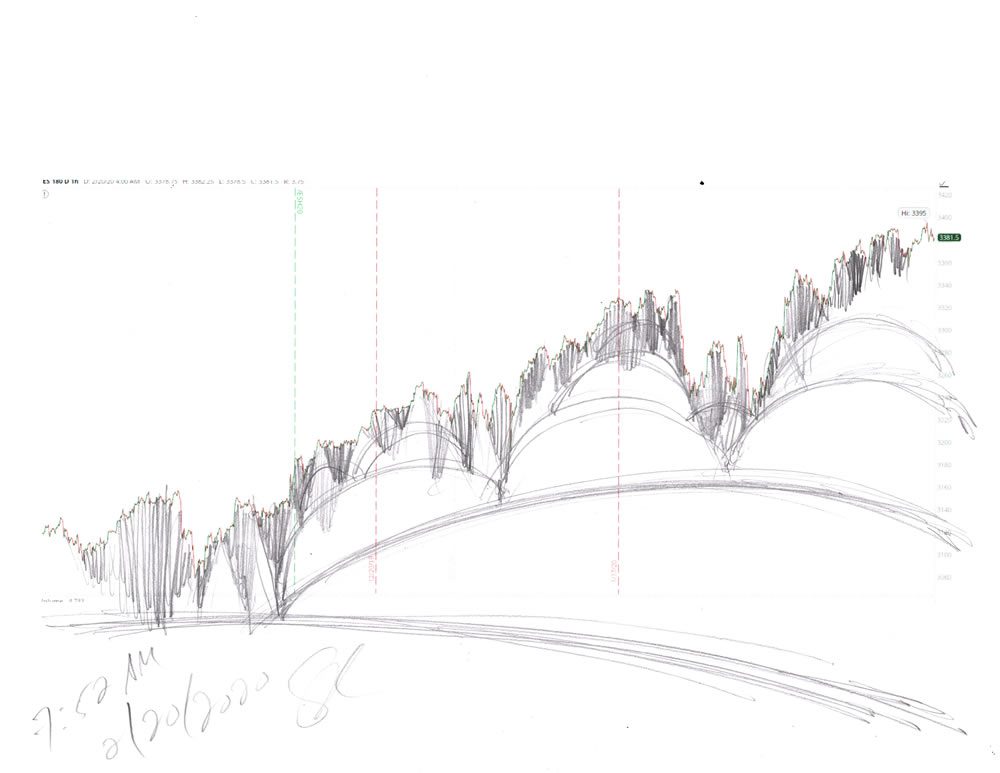
Above is my drawing of the current region of the stock market for the last few months, because this is the most important sector that we need to be concerned with. This is the road that we are currently on, and we need to know our map and GPS.
Pencil Rendering
Below is my drawing of the last 180 days which shows a larger view of the current market, because it puts things into perspective. As you can clearly see from my renderings we are now leaving the very top of the market and headed down to the 22,000 level.
Stock market forecast chart pencil drawing by artist Stephen F. Condren.
Meta Description
Stock market forecast #662Z or stock market architecture charts, pencil rendering by artist Stephen F. Condren with prints & scans predicting future moves.
Alt Image Tag
Stock market forecast #662Z charts by artist Stephen F. Condren.
Image Location
Prints, StockMarket, Dome Architecture, Date
Credits
The charts that are used are from Charles Schwab, with many thanks.
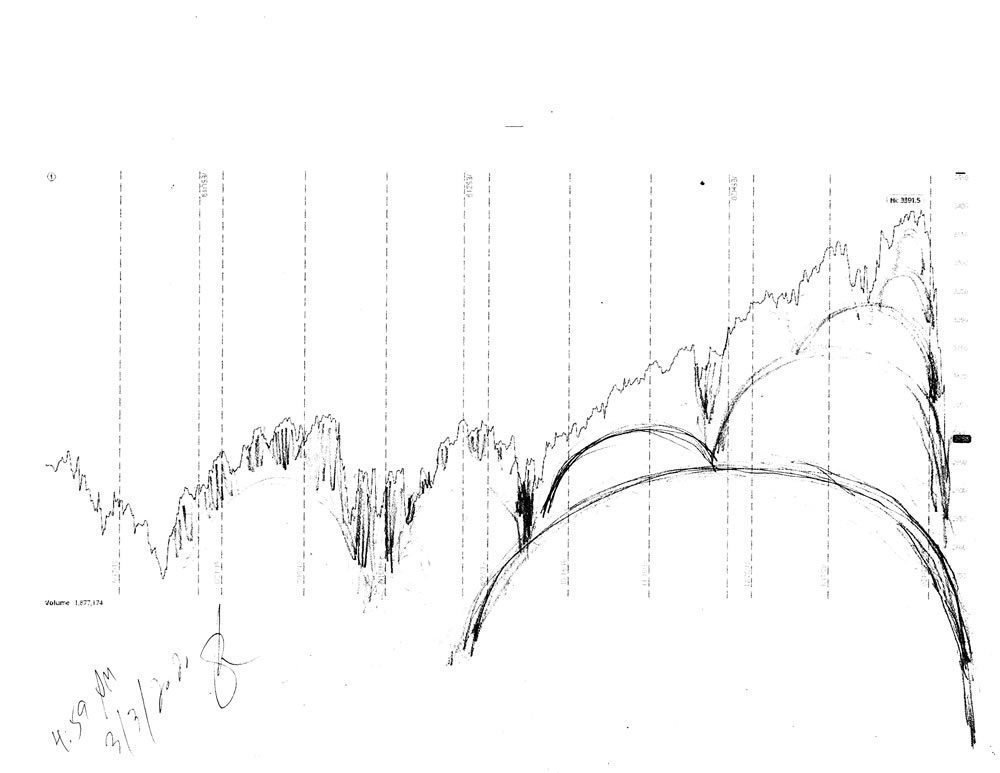
Stock market forecast #661Z or stock market architecture charts, pencil rendering by artist Stephen F. Condren, of CondrenGalleries, with prints, and scans predicting future stock market moves. Prints & Scans Of This Drawing #661Z ~ Order Here.
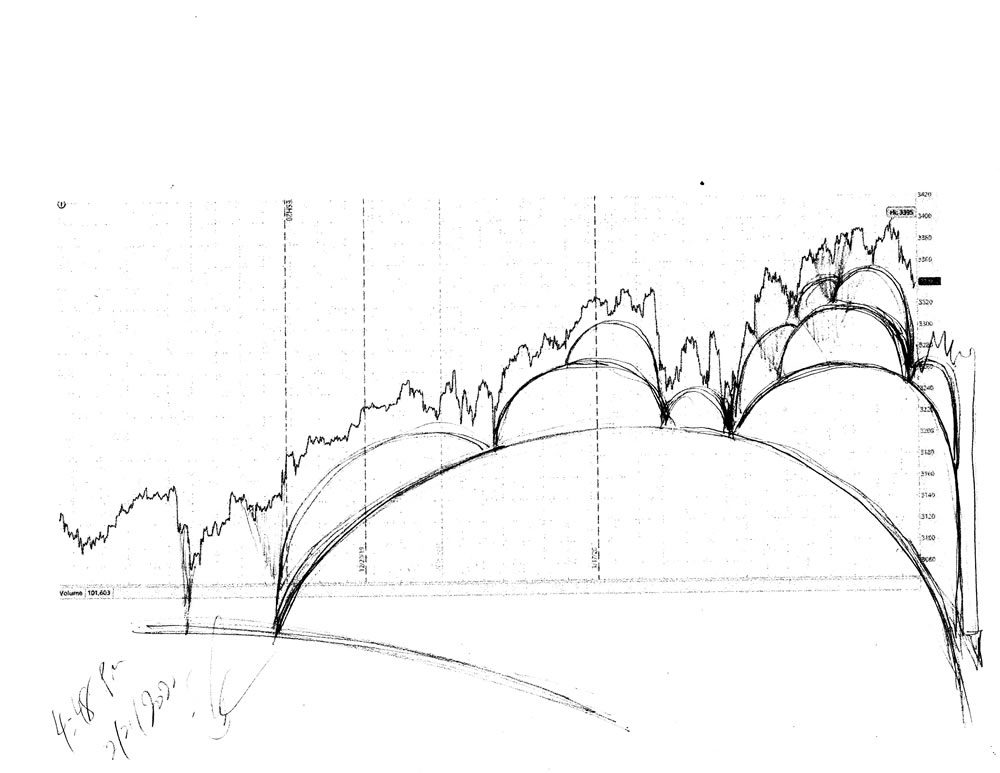
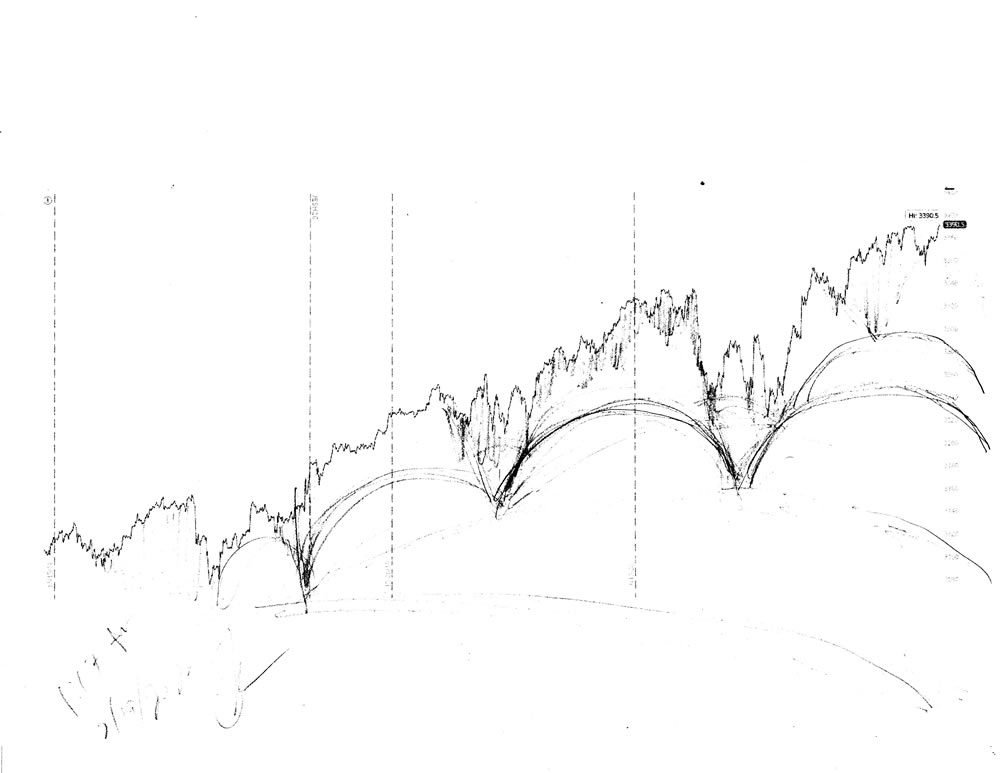
From my chart above, you can see that we have past the half way point in the FOMC Bubble and are now headed down to the 22,000 level, because the dome is now ending. As you can see the current dome that we are on is the same as the coiled head of a rattle snake waiting to strike, because this is organic, and how Nature works. In the same manner as a surfer on a tidal wave, the peak is just before the crash on the sea shore.
Pencil Rendering
If you look carefully you can see the series of smaller domes that rest upon the larger ones, because this is organic.
Meta Description
Stock market forecast #661Z or stock market architecture charts, pencil rendering by artist Stephen F. Condren with prints & scans predicting future moves.
Alt Image Tag
Stock market forecast #661Z charts by artist Stephen F. Condren.
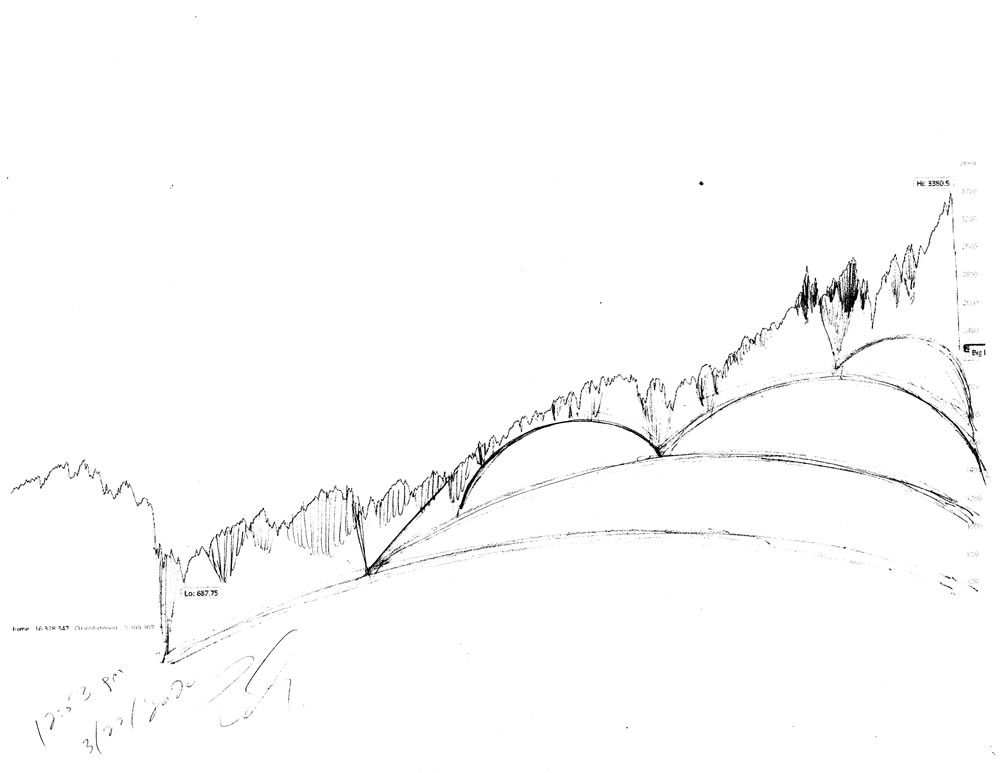
Stock market forecast #646Z or Dome Architecture charts, pencil rendering by artist Stephen F. Condren, of CondrenGalleries, with prints, and scans predicting future stock market moves. Prints & Scans Of This Drawing #646Z ~ Order Here.
As you can see from my chart above we are at the very pinnacle of the stock market, because we are on the smallest bubbles, or domes.
Pencil Rendering
When you carefully look over my rendering you will see the alignment of domes that are resting on a yet larger dome, because these larger domes support the smaller one that are above.
Meta Description
Stock market forecast #646Z or Dome Architecture charts, pencil rendering by artist Stephen F. Condren with prints & scans predicting future moves.
Alt Image Tag
Stock market forecast #646Z or Dome Architecture charts by artist Stephen F. Condren.
Image Location
Prints, Stock Market, 2020, February, 2/19/2020
Credits
The charts that are used are from Charles Schwab, with many thanks.
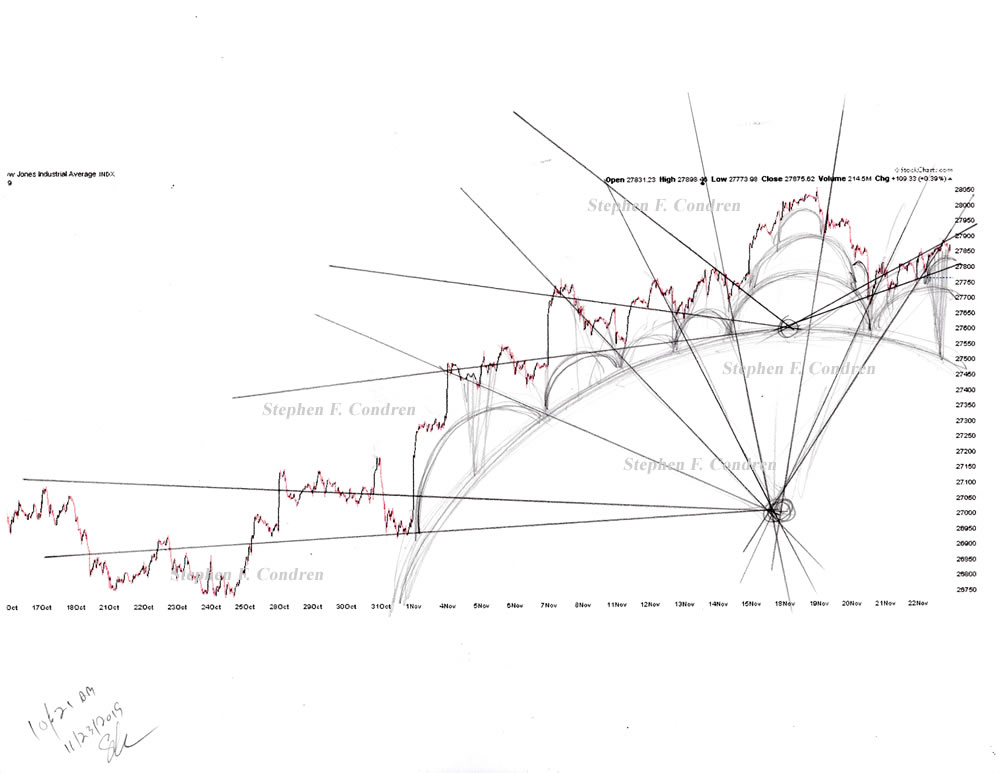
Stock market architecture #638Z or stock market forecast charts, pencil rendering by artist Stephen F. Condren, of CondrenGalleries, with prints, and scans predicting future stock market moves. Prints & Scans Of This Drawing #638Z ~ Order Here.
As you can see from my drawing above we are at the end of the FOMC bubble that was created last December, because the footers show the path of the dome that supports this ephemeral bubble.
House portrait by artist Stephen F. Condren.
Pencil Rendering
In the drawing below I have offering a different study for Dome Architecture, because this shows the footers along the dome. However, I think the error in this drawing is in the fact that the footers are too close in the first part of the rally, and not so far.
Stock market forecast chart pencil drawing by artist Stephen F. Condren.
Below is another rendering of my study, however, this is less likely, but at least another plausible offering. The killer to this rendering is not taking into account the large footers of the last week, because footers that are big, or vastly deep, are not so close to the dome that supports them.
Stock market forecast chart pencil drawing by artist Stephen F. Condren.House portrait by artist Stephen F. Condren.
Meta Description
Stock market architecture #638Z or stock market forecast charts, pencil rendering by artist Stephen F. Condren with prints & scans predicting future moves.
Alt Image Tag
Stock market architecture #638Z or stock market forecast charts by artist Stephen F. Condren.
Image Location
Prints, StockMarket, Dome Architecture, Date
Credits
The charts that are used are from StockCharts.com, with many thanks.
Stock market architecture #637Z or stock market forecast charts, pencil rendering by artist Stephen F. Condren, of CondrenGalleries, with prints, and scans predicting future stock market moves. Prints & Scans Of This Drawing #637Z ~ Order Here.
As you can see from my drawing above, the image looks just like bubbles on a bar of soap, because that is exactly what it is.
Pencil Rendering
The rendering gives us a series of domes that supports the structure of the stock market, because the smaller domes rest upon the larger ones. Since all the processing of waves, and stock market data is material, it is processed organically, likes waves in the ocean are. Just like the ebb and flow of the tides, so too, the ebb and flow of the stock market current.
Meta Description
Stock market architecture #637Z or stock market forecast charts, pencil rendering by artist Stephen F. Condren with prints & scans predicting future moves.
Alt Image Tag
Stock market architecture #637Z or stock market forecast charts by artist Stephen F. Condren.
Image Location
Prints, StockMarket, Dome Architecture, Date
Credits
The charts that are used are from StockCharts.com, with many thanks.