Posted on

Stock Market Architecture #636Z

Stock market architecture #636Z or stock market forecast charts by artist Stephen F. Condren.

Stock market architecture #636Z or stock market forecast charts, pencil rendering by artist Stephen F. Condren, of Condren Galleries, with prints, and scans predicting future stock market moves. Prints & Scans Of This Drawing #636Z ~ Order Here.

Posted on Google+, Facebook, Twitter, Linked-in, and Tumblr.

Stock Market Architecture

Stock Market Analysis

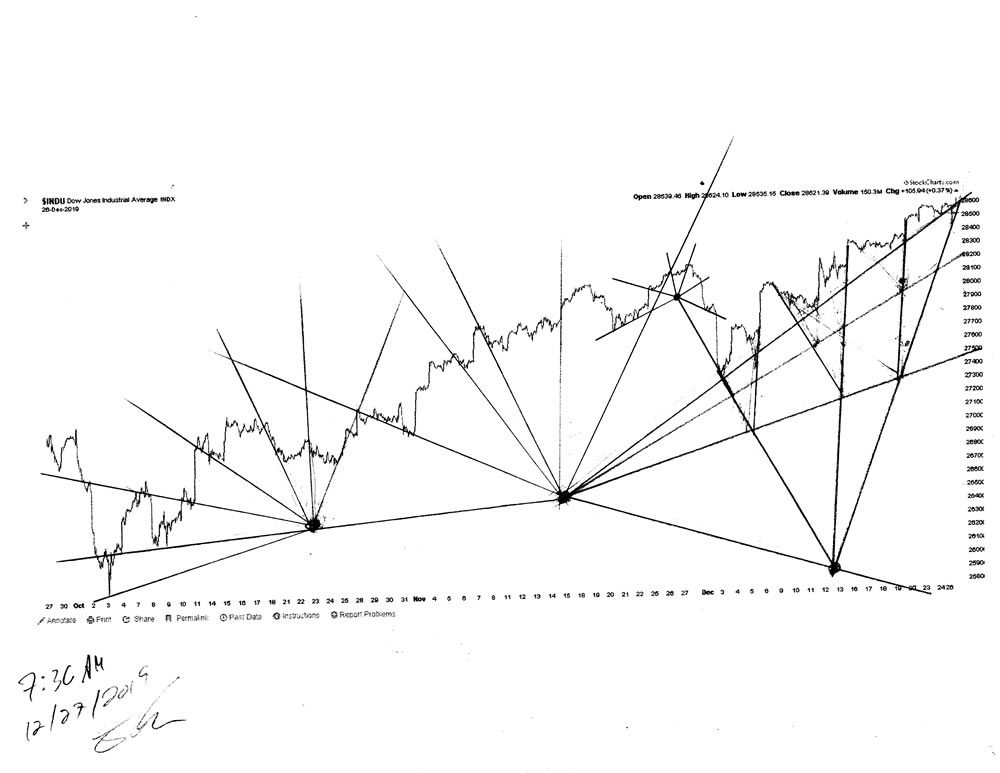
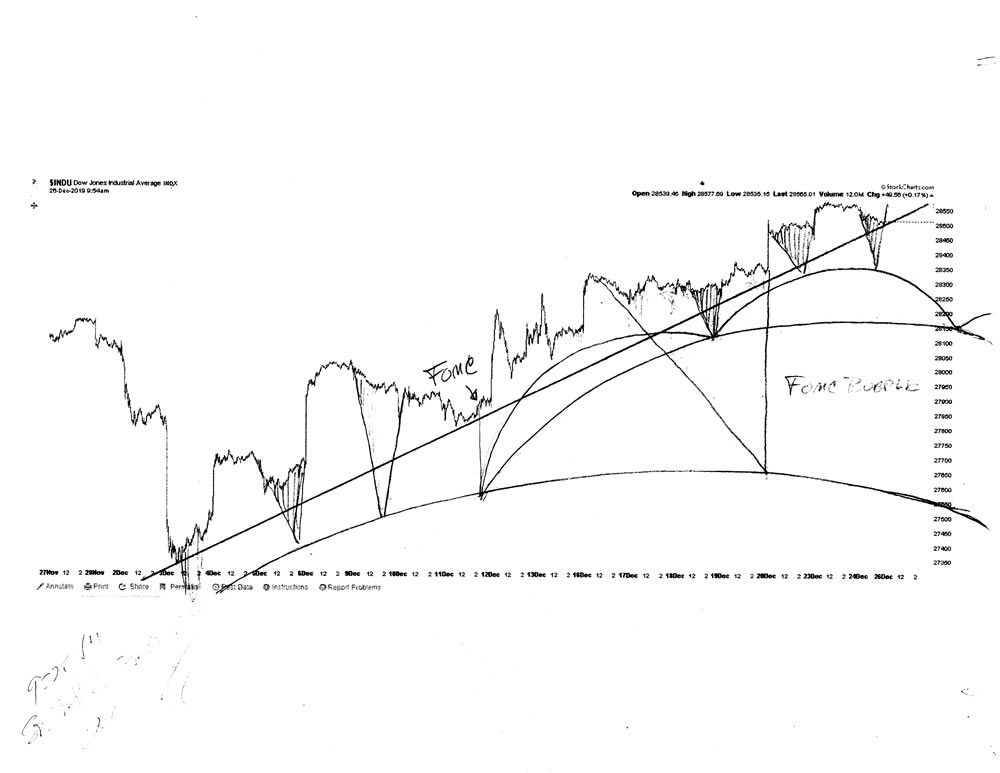
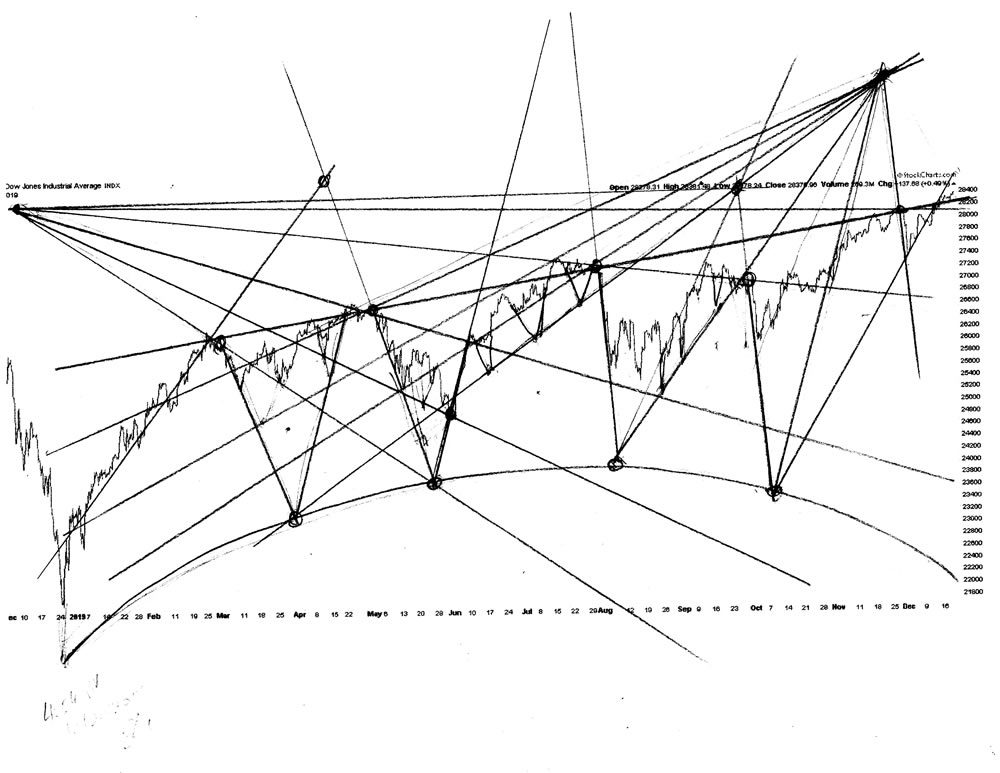
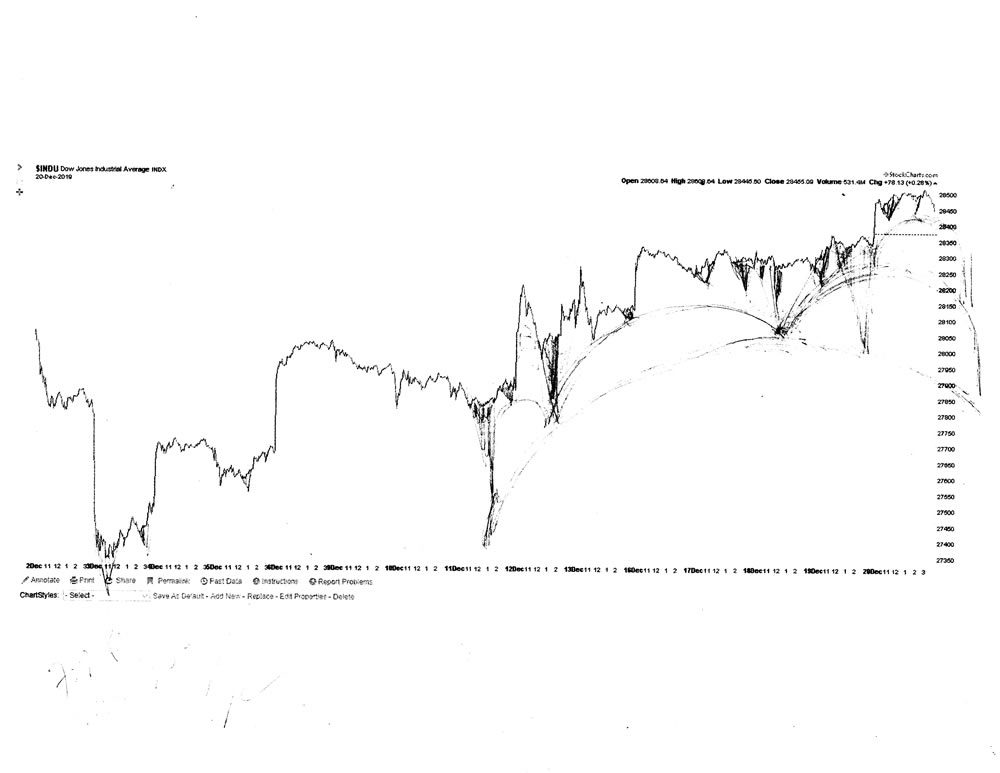
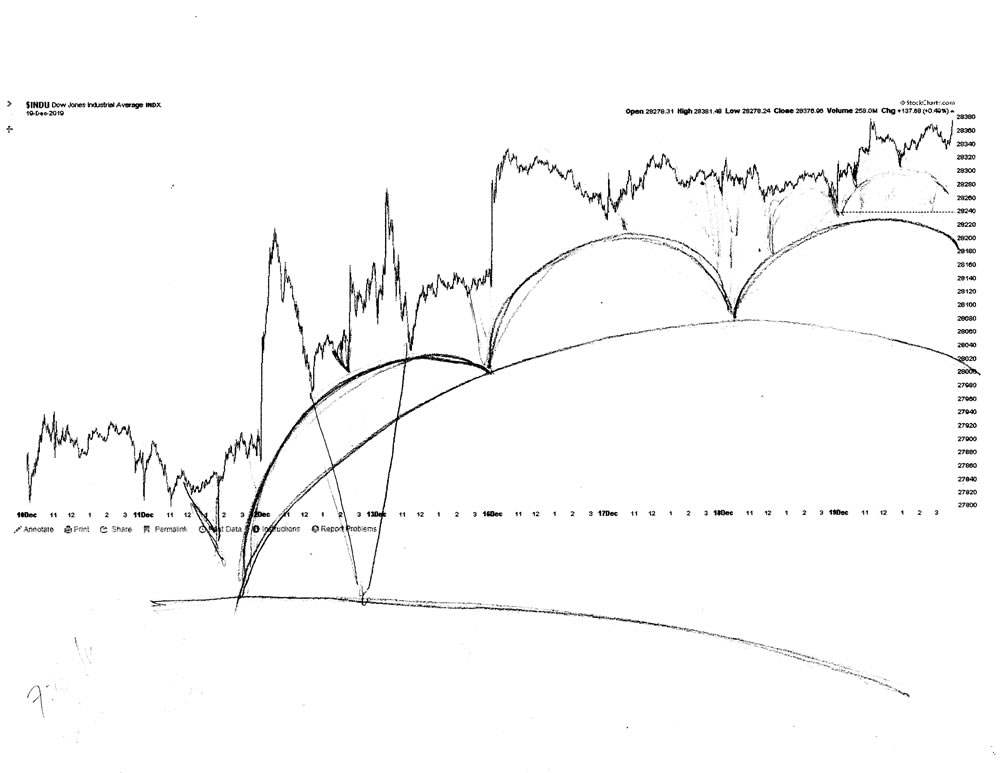
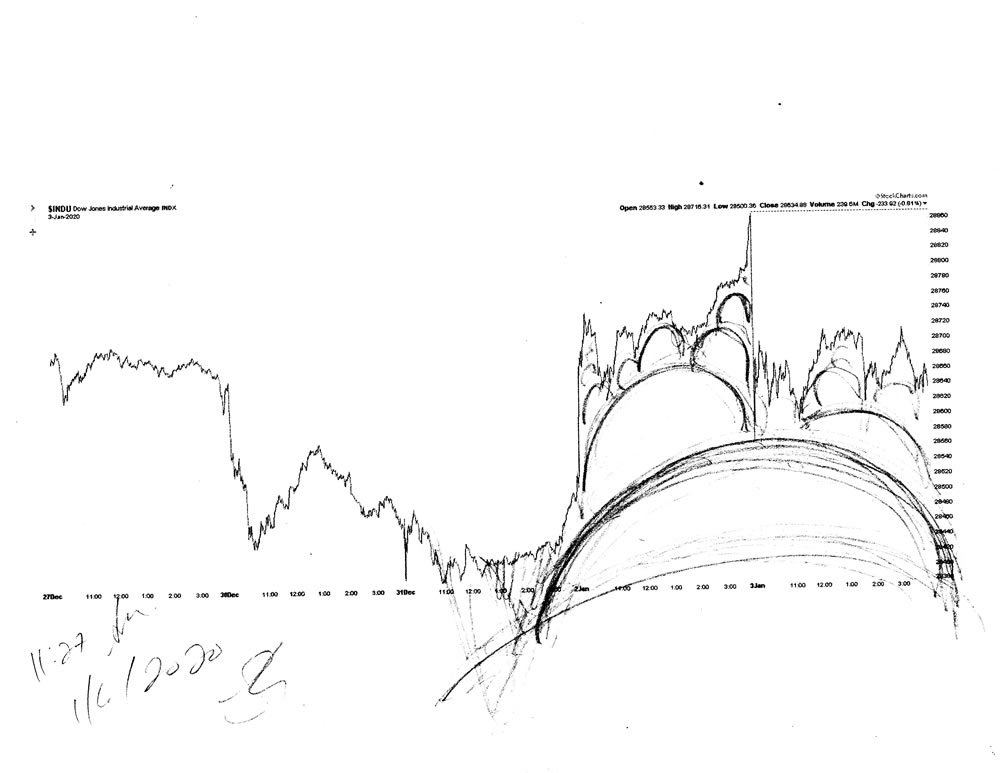
From my video above, and the drawings as well, you can see the direction of the current stock market, because it is now going down. It must be understood that my drawings are theoretical and not iron clad, because they contain errors. As an artist I know for a fact that every single work of art that I produce contains errors, thus so do my stock market forecast charts. However, all of my forecasts are based on facts, not opinion.

Pencil Rendering

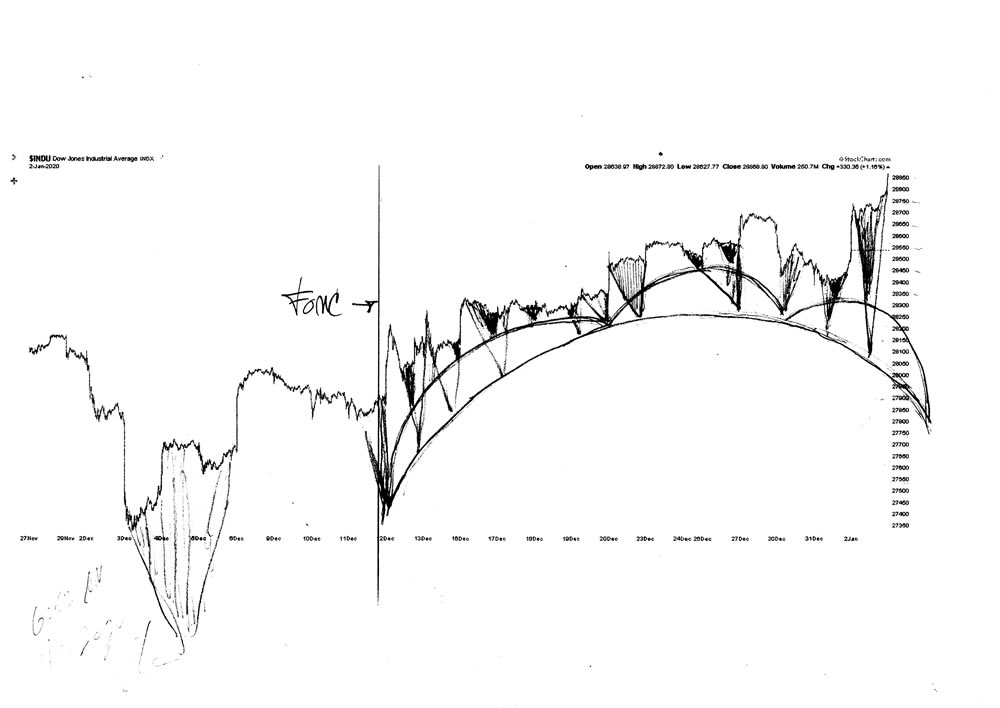
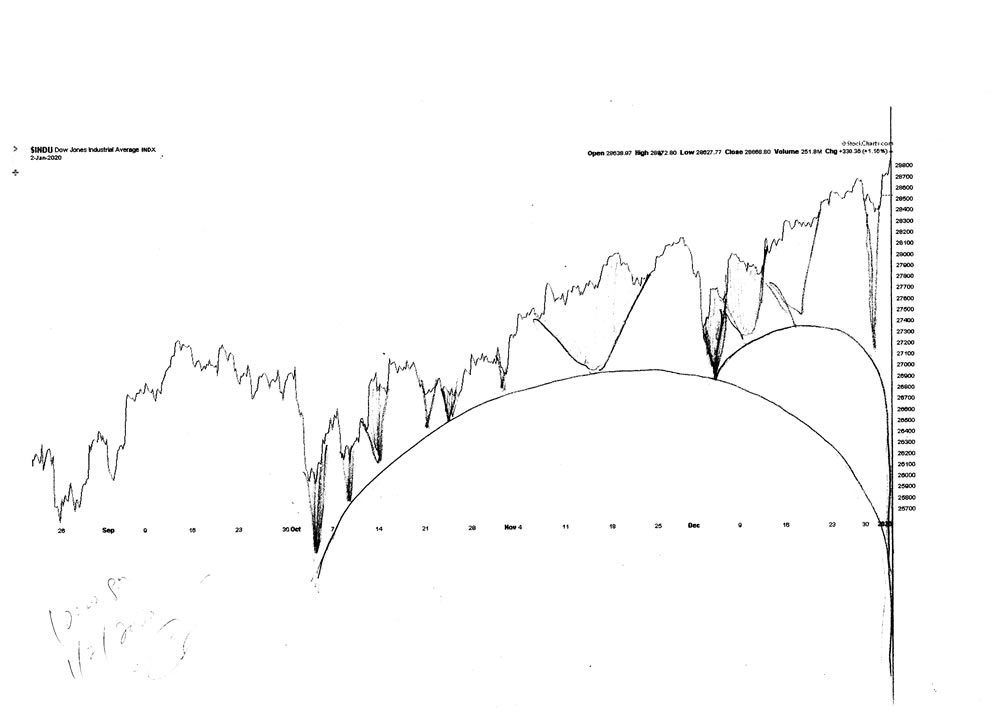
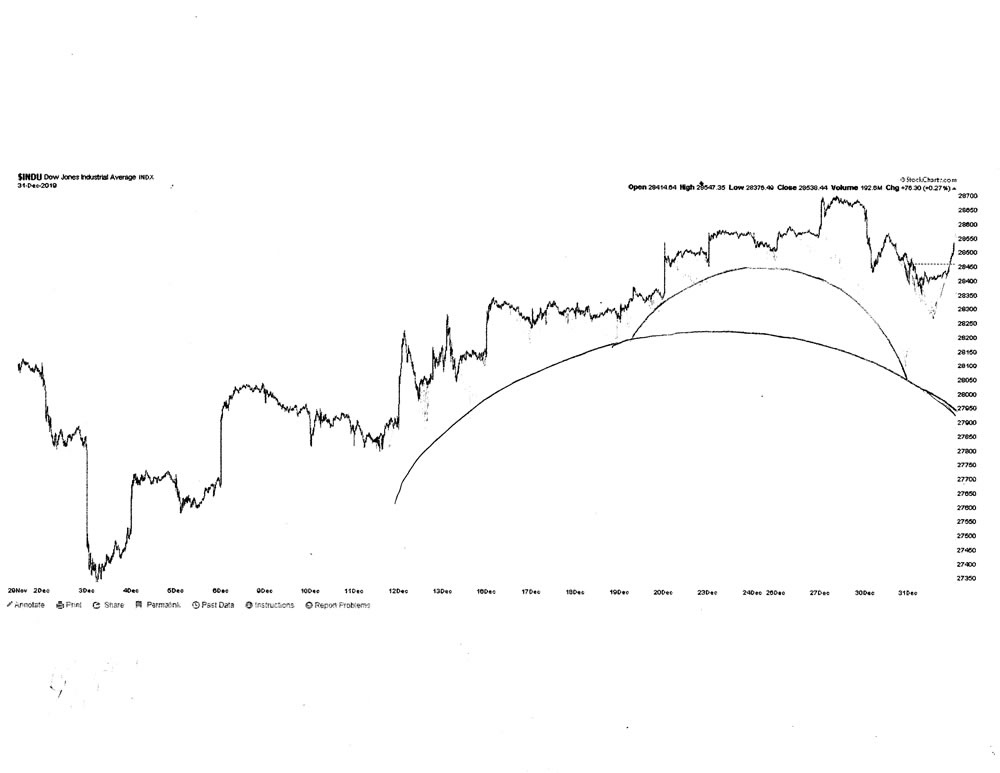
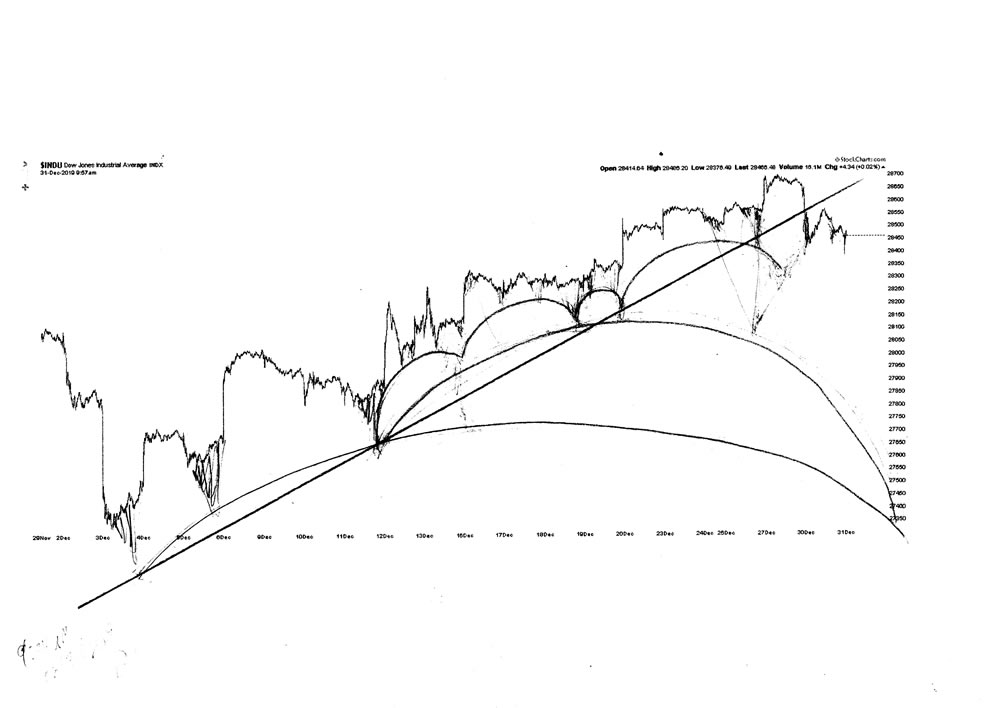
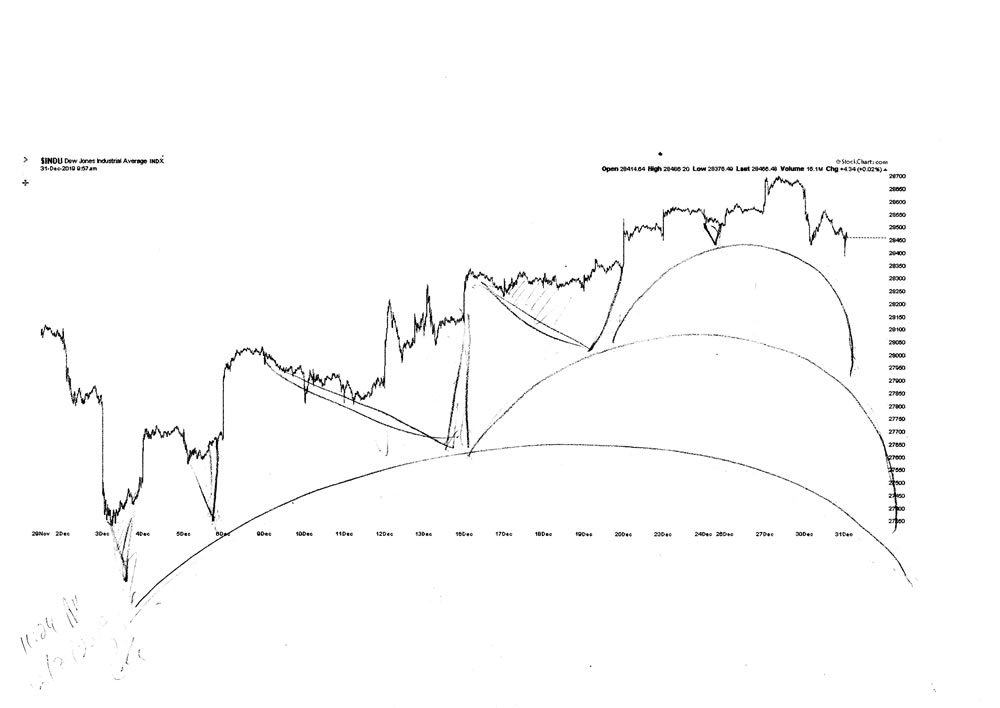
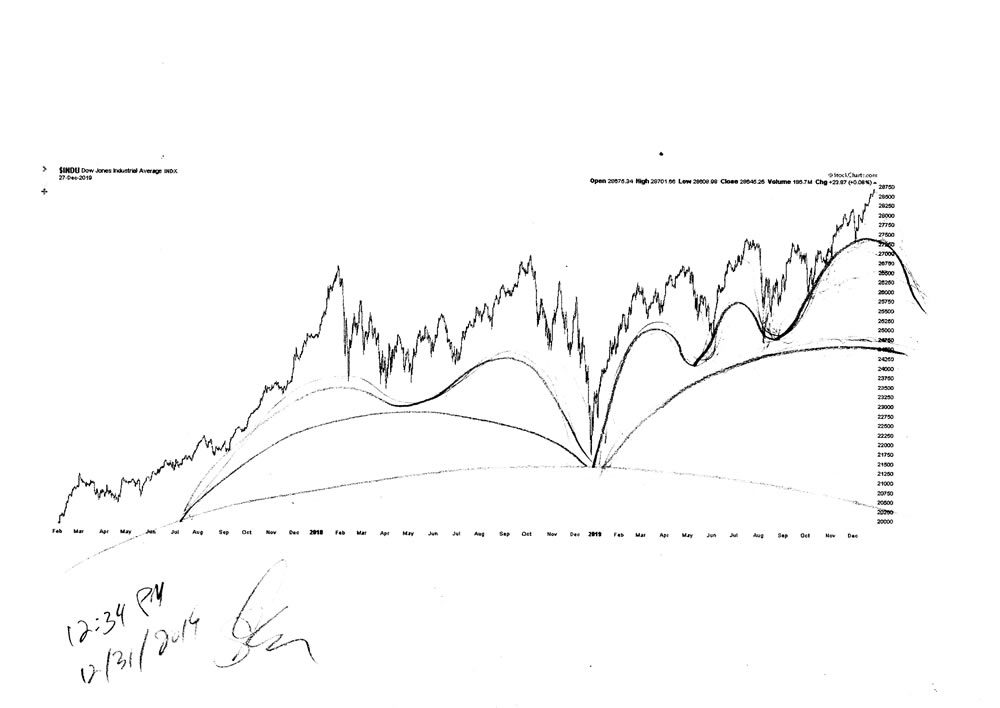
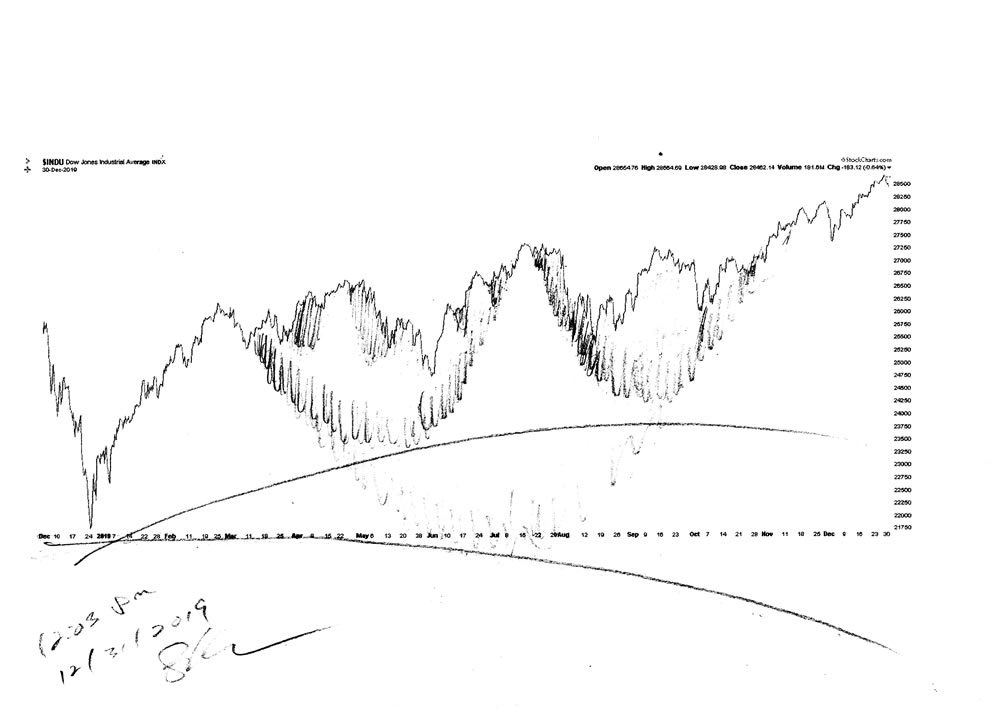
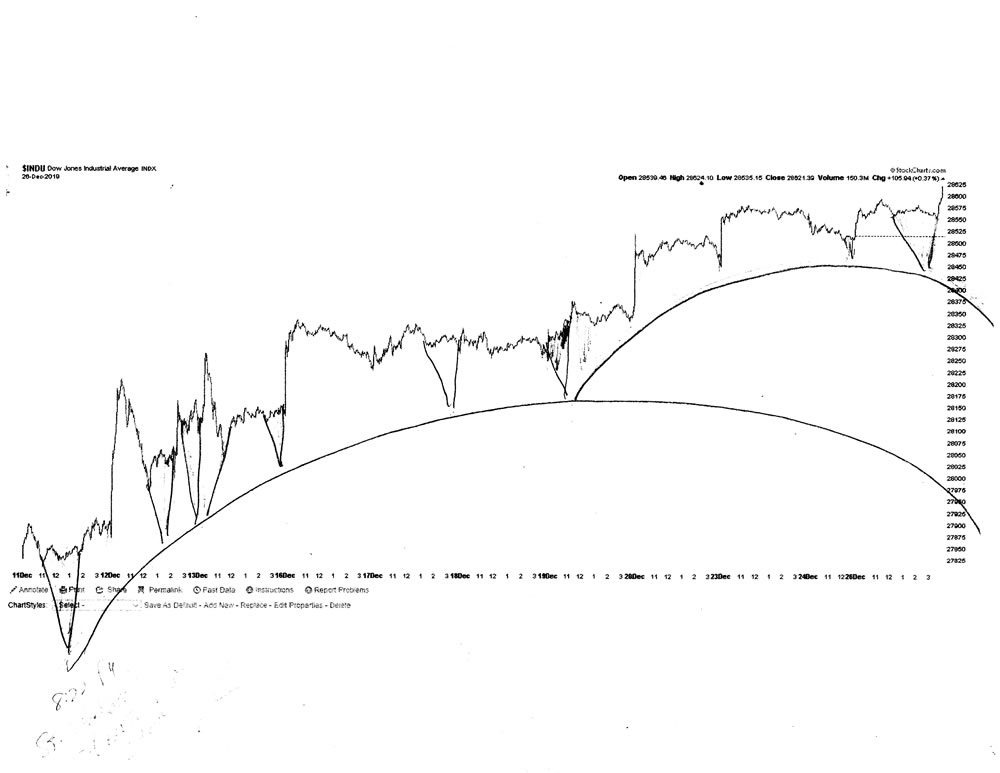
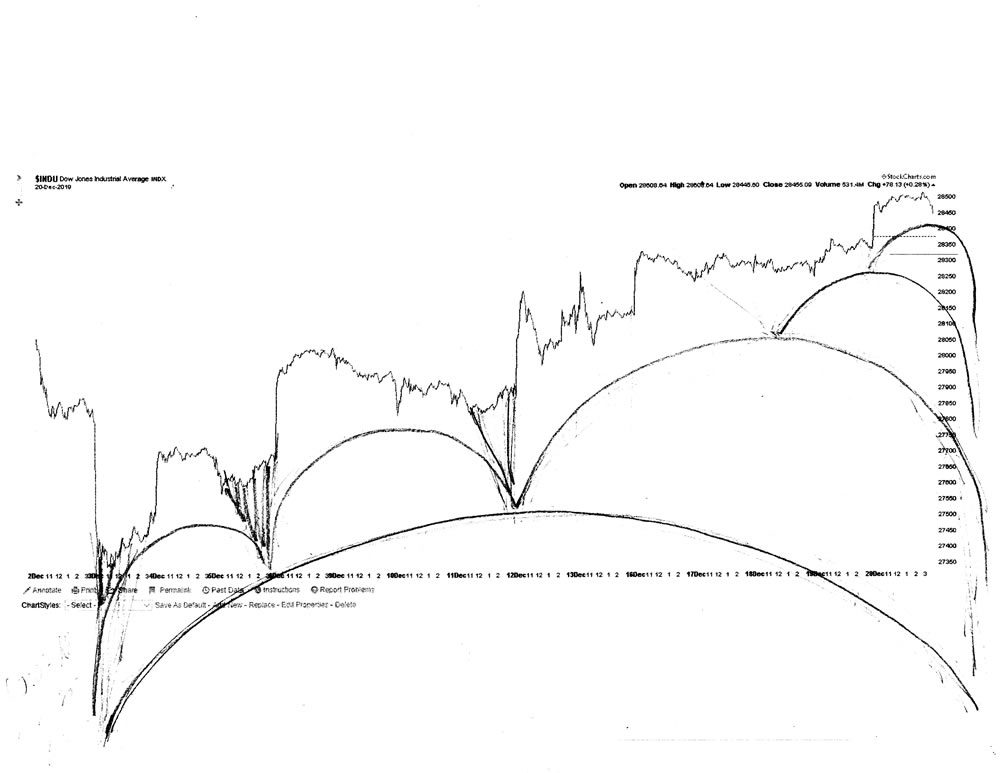
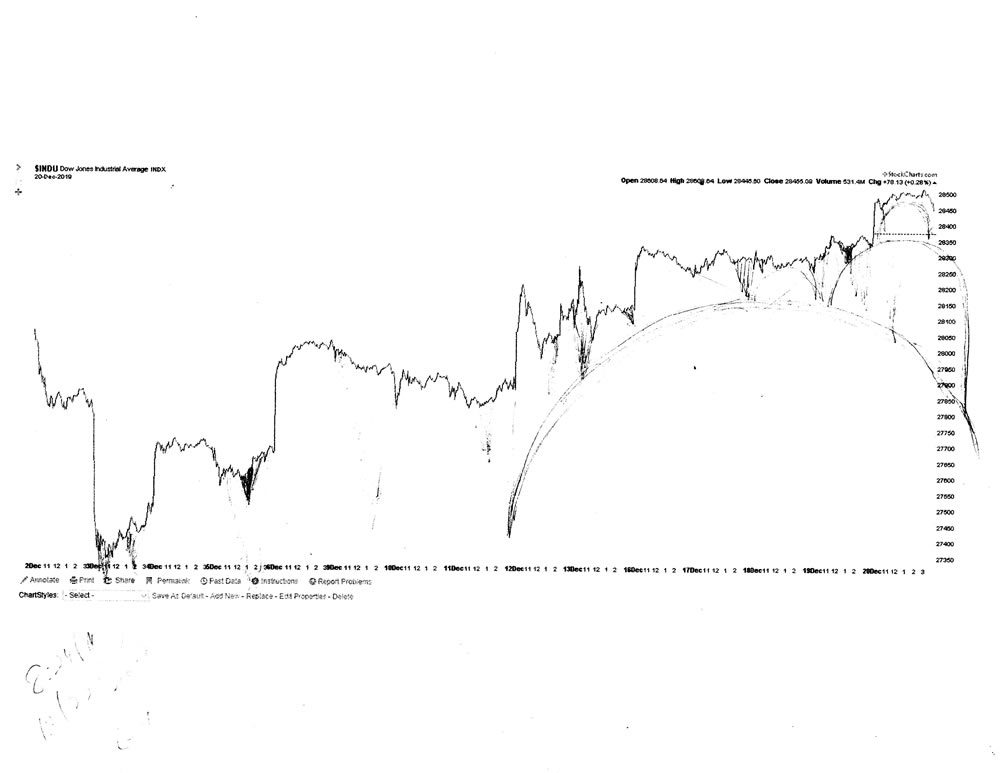
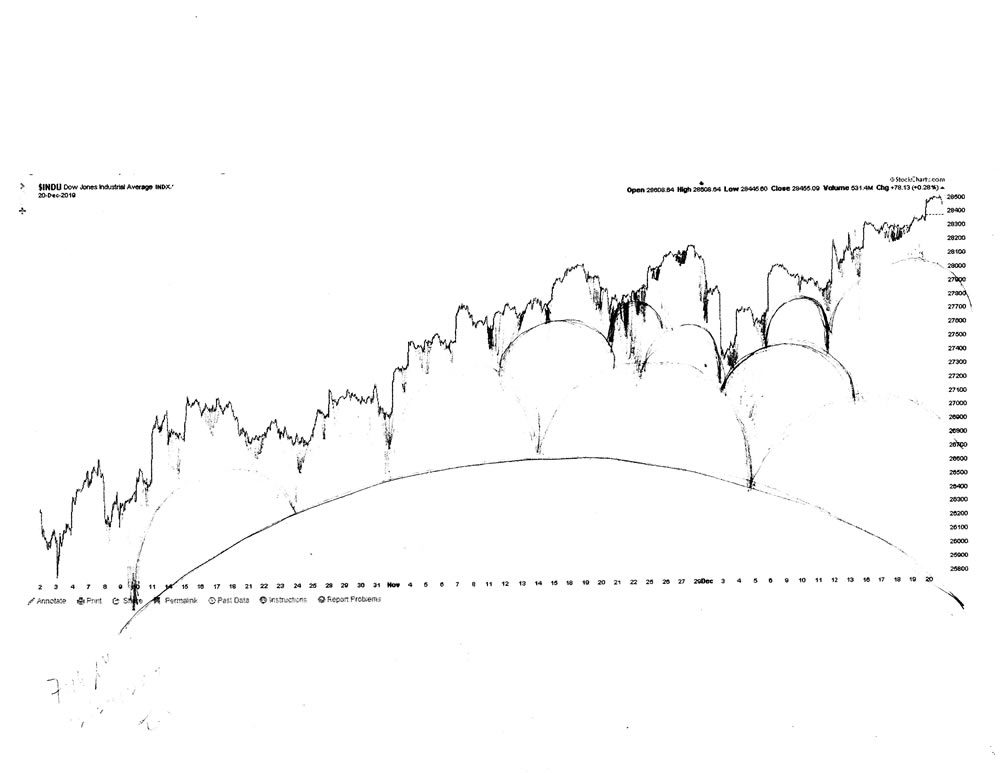
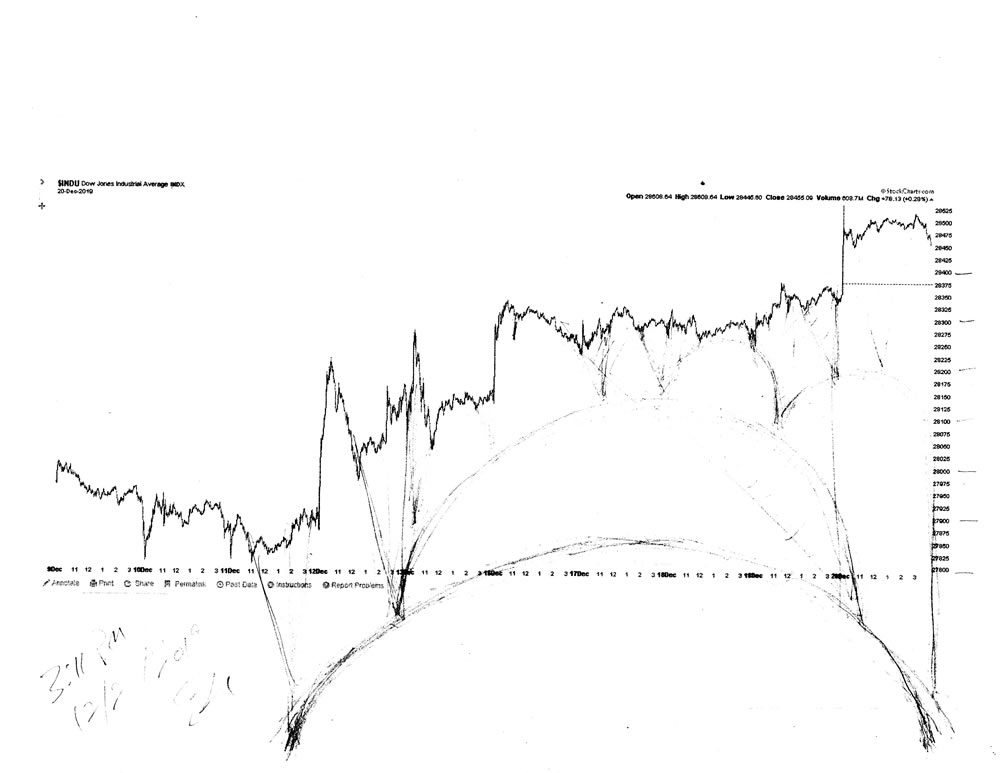
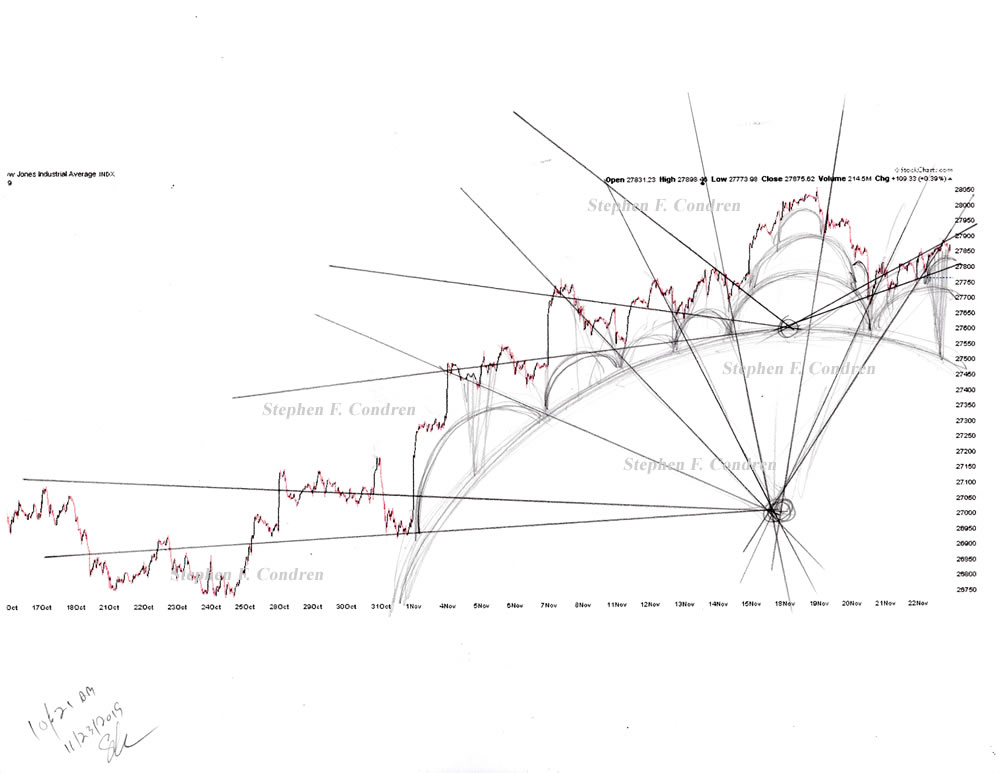
The renderings clearly show the domes that hold up the market, because these are set out in advance by the stock market codes, because it is organic. Like DNA, all of the patters of the stock market codes are set up in advance and only alter by market contingencies.

Stock market architecture #636Z or stock market forecast charts by artist Stephen F. Condren.
Stock market forecast chart pencil drawing by artist Stephen F. Condren.

Domes Or Bubbles

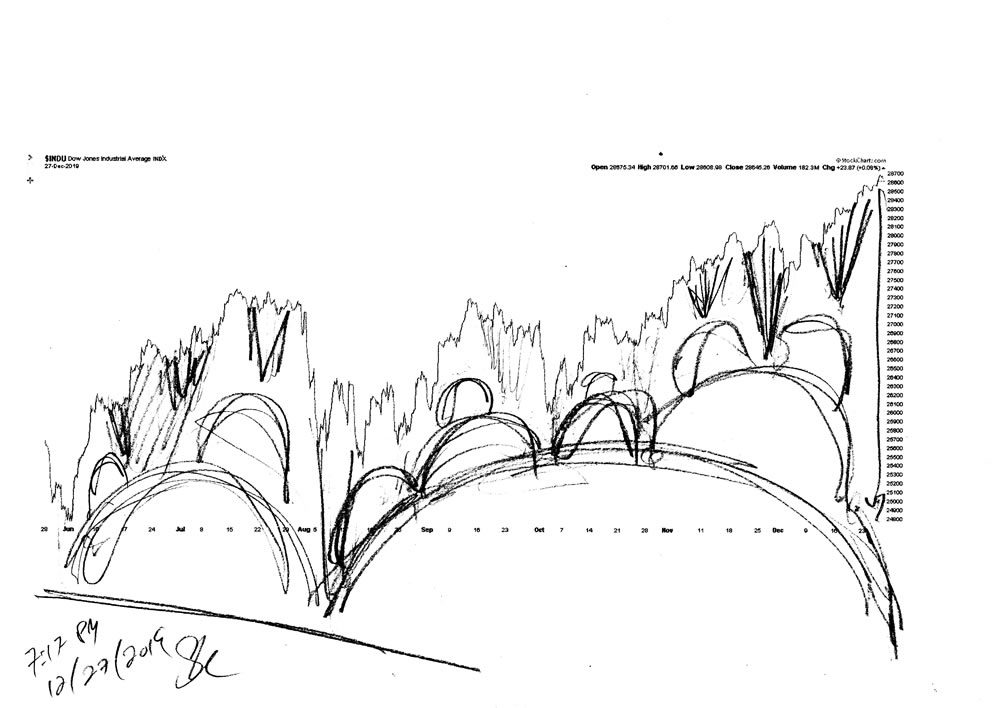
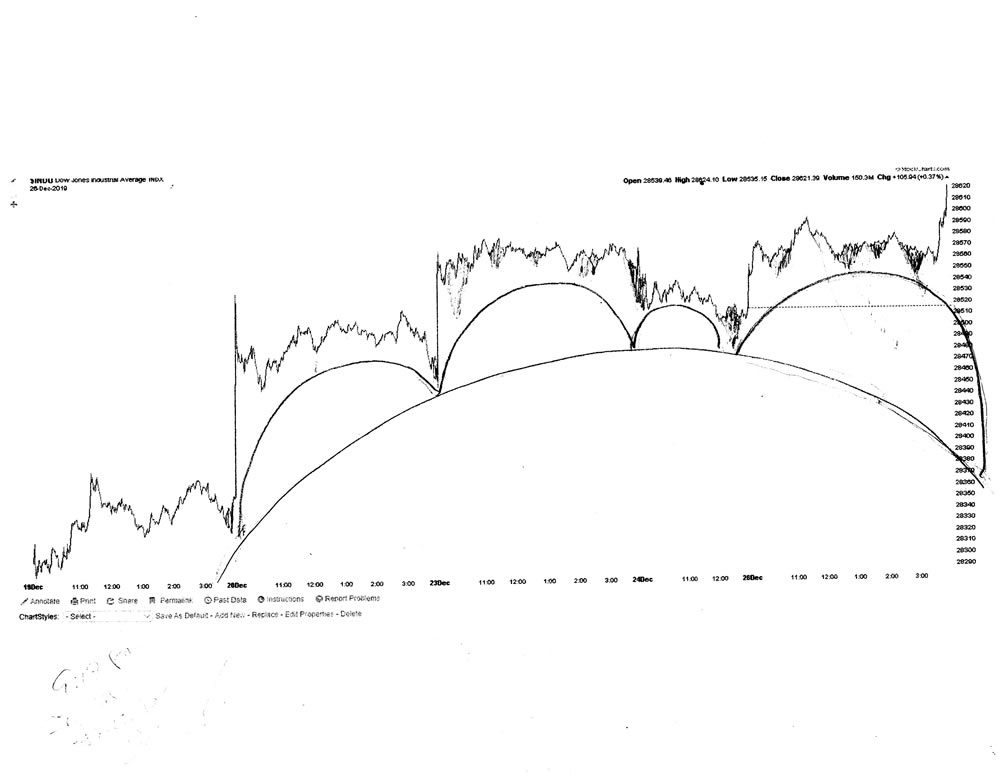
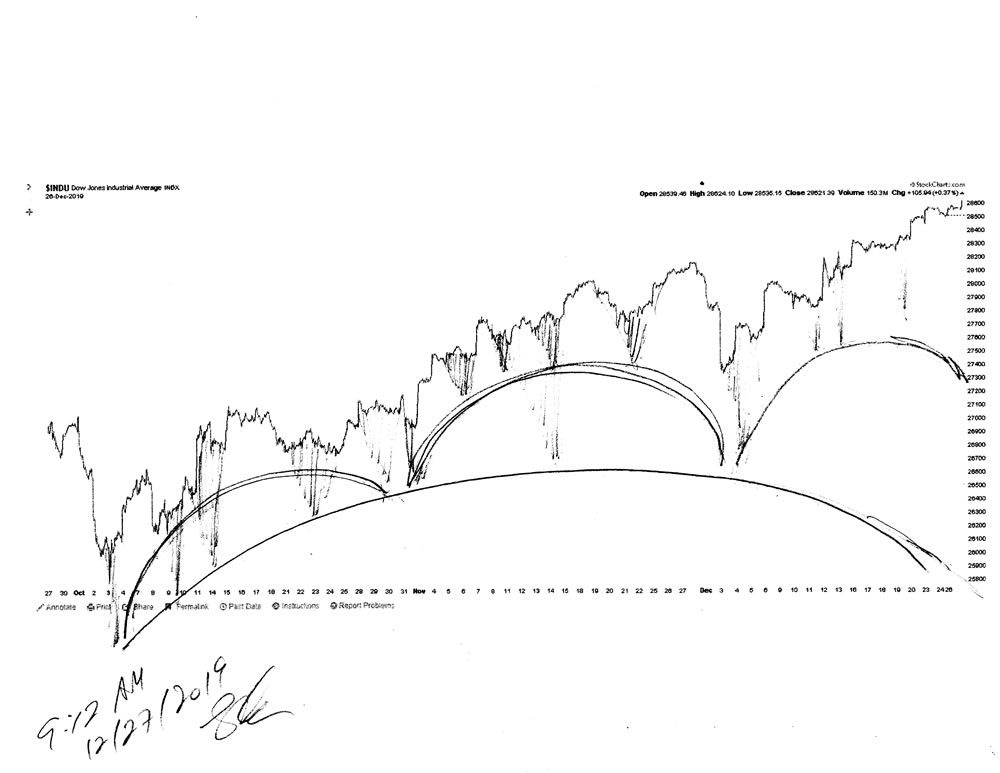
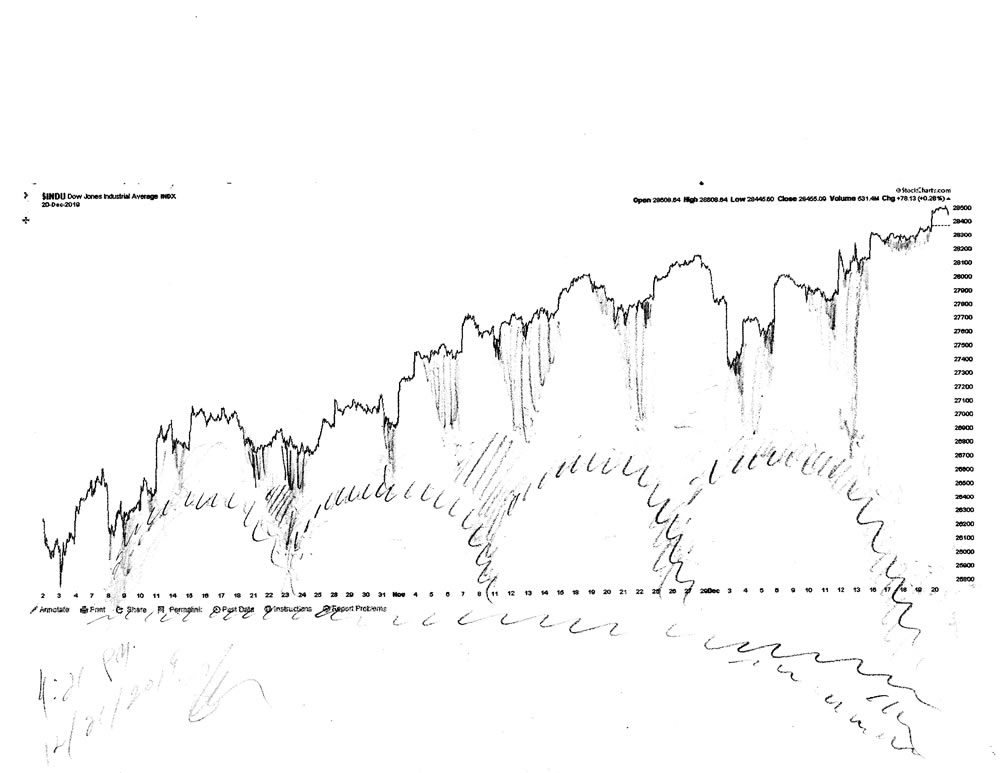
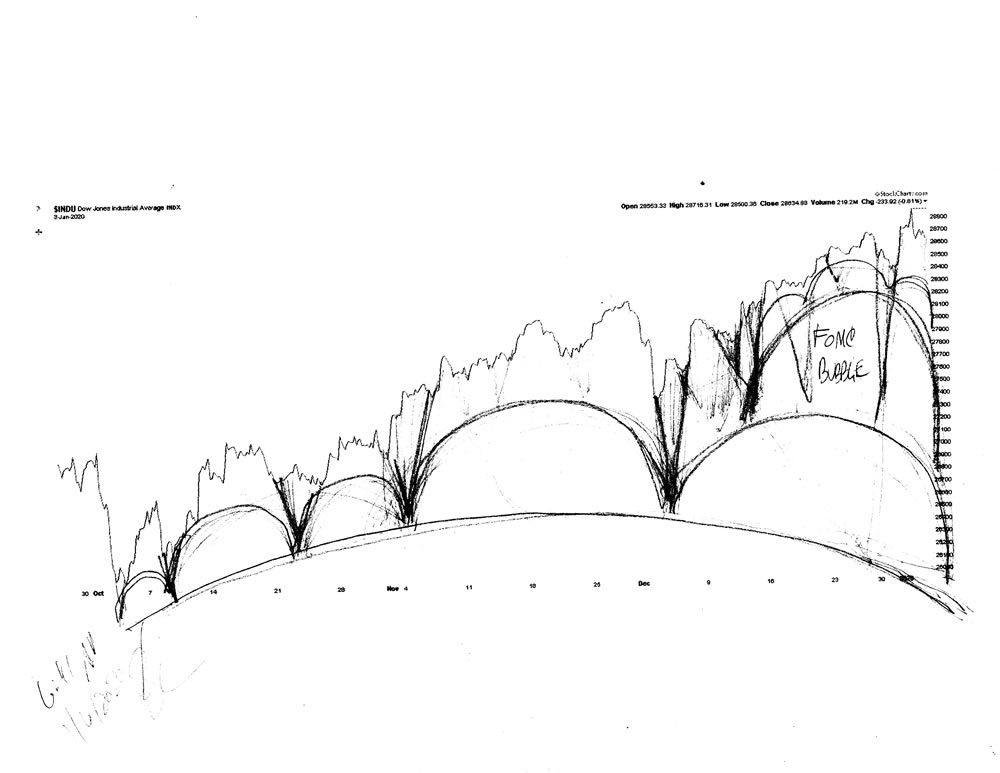
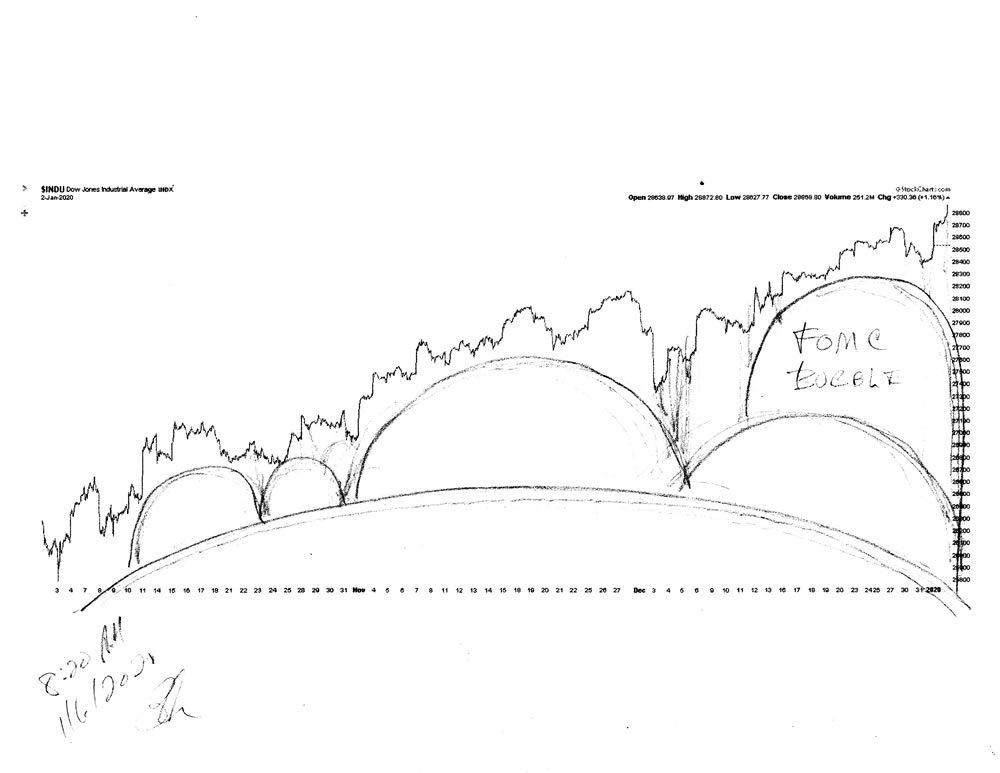
It is very important to understand that as the stock market goes higher the domes are getting smaller, because they are like tweeters and woofers for stereo speakers. The higher range music is lighter and uses small sine waves, whereas the lower music tones for the base baritones, or base cleff use woofers, because they need larger sine waves to carry the sound.

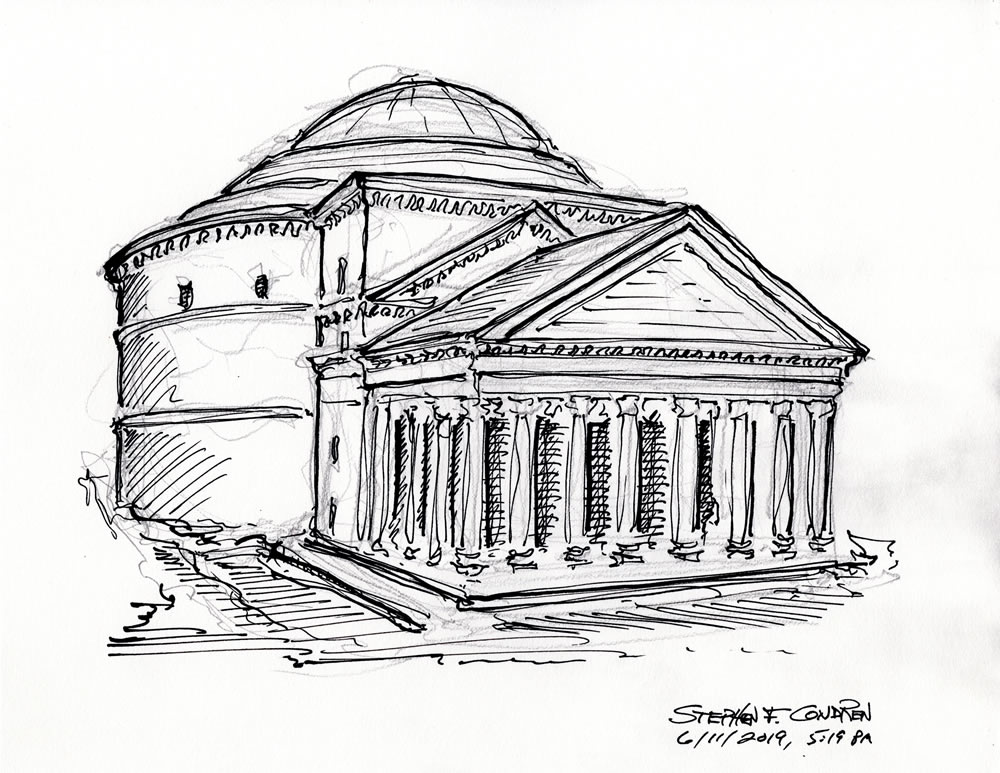
So too with stock market domes, for the higher domes a small, as you can see from the image right below. You cannot build Pantheon or the Roman Colosseum on day long bubbles! To do that you need vast scale domes that are thousands of points below.

Pen & ink drawing of Pantheon in Rome by artist Stephen F. Condren.
Pen & ink drawing of the Pantheon in Rome.
Stock market architecture #636Z or stock market forecast charts by artist Stephen F. Condren.
Stock market forecast chart pencil drawing by artist Stephen F. Condren.

Meta Description

Stock market architecture #636Z or stock market forecast charts, pencil rendering by artist Stephen F. Condren with prints & scans predicting future moves.

Alt Image Tag

Stock market architecture #636Z or stock market forecast charts by artist Stephen F. Condren.

Image Location

Prints, StockMarket, Dome Architecture, Date

Credits

The charts that are used are from StockCharts.com, with many thanks.

Stephen F. Condren ~ Artist

Related Links

Stock Market Architecture #635Z

Posted on

Stock Market Architecture #635Z

Stock market architecture #635Z or stock market forecast charts by artist Stephen F. Condren.

Stock market architecture #635Z or stock market forecast charts, pencil rendering by artist Stephen F. Condren, of Condren Galleries, with prints, and scans predicting future stock market moves. Prints & Scans Of This Drawing #635Z ~ Order Here.

Posted on Google+, Facebook, Twitter, Linked-in, and Tumblr.

Stock Market Architecture

Stock Market Analysis

As you can see from my drawing above, it seem very clear to me that the final details for completing the formation of the FOMC Dome of December 11th, is done. In the upper right corner you can see the series of tiny bubble rushing to the very top to form a cantilever over all the bubbles below to make a very dramatic drop.

Pencil Rendering

The timing and detailing of the pending drop in the stock market should not be far off. It can be as soon as tomorrow or next week. Above all things it look immanent.

Stock market architecture #635Z or stock market forecast charts by artist Stephen F. Condren.
Stock market forecast chart pencil drawing by artist Stephen F. Condren.

Meta Description

Stock market architecture #635Z or stock market forecast charts, pencil rendering by artist Stephen F. Condren with prints & scans predicting future moves.

Alt Image Tag

Stock market architecture #635Z or stock market forecast charts by artist Stephen F. Condren.

Image Location

Prints, StockMarket, Dome Architecture, Date

Credits

The charts that are used are from StockCharts.com, with many thanks.

Stephen F. Condren ~ Artist

Related Links

Stock Market Architecture #634Z

Posted on

Stock Market Architecture #634Z

Stock market architecture #634Z or stock market forecast charts by artist Stephen F. Condren.

Stock market architecture #634Z or stock market forecast charts, pencil rendering by artist Stephen F. Condren, of Condren Galleries, with prints, and scans predicting future stock market moves. Prints & Scans Of This Drawing #634Z ~ Order Here.

Posted on Google+, Facebook, Twitter, Linked-in, and Tumblr.

Stock Market Architecture

Stock Market Analysis

From my drawing above you can see that the stock market is going to commence it’s downward path to the 22,000, the second week of January, 2020, because the codes have dictated this. The two domes that you see are due to the FOMC meeting of December 11, 2019, which caused an artificial rally. This has now been completed and now the dust of the aftermath from this rally will settle down, and then the market will head downward.

Pencil Rendering

The rendering above shows the domes that make up this section of the stock market that is now complete, because the stock market, like water, seeks it’s own level. In other works the codes of the market are always looking for larger bubbles to process their codes on. It is impossible for the stock market to go any higher because it has to get back to the base of the lowest bubble. You cannot build the Roman Empire on a day long bubble. The stock market needs a vast base to do that from, and that is clearly not here. The size of the base bubble determines how high the market will go in that region. The market has to go back to the base of the bubble to then hop up to the next large base platform.

Meta Description

Stock market architecture #634Z or stock market forecast charts, pencil rendering by artist Stephen F. Condren with prints & scans predicting future moves.

Alt Image Tag

Stock market architecture #634Z or stock market forecast charts by artist Stephen F. Condren.

Image Location

Prints, StockMarket, Dome Architecture, Date

Credits

The charts that are used are from StockCharts.com, with many thanks.

Stephen F. Condren ~ Artist

Related Links

Stock Market Architecture #633Z

Posted on

Stock Market Architecture #633Z

Stock market architecture #633Z or stock market forecast charts by artist Stephen F. Condren.

Stock market architecture #633Z or stock market forecast charts, pencil rendering by artist Stephen F. Condren, of Condren Galleries, with prints, and scans predicting future stock market moves. Prints & Scans Of This Drawing #633Z ~ Order Here.

Posted on Google+, Facebook, Twitter, Linked-in, and Tumblr.

Stock Market Architecture

Stock Market Analysis

As you can see from my chart below, the stock market has just reached it’s peak, and is now heading down, because the codes of the market have indicated this.

Stock market architecture #633Z or stock market forecast charts by artist Stephen F. Condren.
Stock market forecast chart pencil drawing by artist Stephen F. Condren.
Stock market architecture #633Z or stock market forecast charts by artist Stephen F. Condren.
Stock market forecast chart pencil drawing by artist Stephen F. Condren.
Stock market architecture #633Z or stock market forecast charts by artist Stephen F. Condren.
Stock market forecast chart pencil drawing by artist Stephen F. Condren.

Pencil Rendering

The two renderings below are alternate studies, or proposals that I have offered. They look very good, however, the rays that form the core of this region of the market are more to the left, so I favor the rendering at the top.

Meta Description

Stock market architecture #633Z or stock market forecast charts, pencil rendering by artist Stephen F. Condren with prints & scans predicting future moves.

Alt Image Tag

Stock market architecture #633Z or stock market forecast charts by artist Stephen F. Condren.

Image Location

Prints, StockMarket, Dome Architecture, Date

Credits

The charts that are used are from StockCharts.com, with many thanks.

Stephen F. Condren ~ Artist

Related Links

Stock Market Architecture #631Z

Posted on

Stock Market Architecture #631Z

Stock market architecture #631Z or stock market forecast charts by artist Stephen F. Condren.

Stock market architecture #631Z or stock market forecast charts, pencil rendering by artist Stephen F. Condren, of Condren Galleries, with prints, and scans predicting future stock market moves. Prints & Scans Of This Drawing #631Z ~ Order Here.

Posted on Google+, Facebook, Twitter, Linked-in, and Tumblr.

Stock Market Architecture

Stock Market Analysis

As you can see from my drawing above the stock market is standing on the edge of a great precipice, because it now going to head downward.

Stock market architecture #631Z or stock market forecast charts by artist Stephen F. Condren.
Stock market forecast chart pencil drawing by artist Stephen F. Condren.

Sea Shell

The stock market is composed of waves, billions, upon billions of waves, because it is organic. Like the sea shell in the photo below, the waves of the stock market form a spiral cone to move the market to such tall narrow spires, because like the waves of the sea, the stock market is organic.

Stock market architecture #631Z or stock market forecast charts by artist Stephen F. Condren.
Photo of a sea shell shaped like a long spiral cone, like the tock market.

Meta Description

Stock market architecture #631Z or stock market forecast charts, pencil rendering by artist Stephen F. Condren with prints & scans predicting future moves.

Alt Image Tag

Stock market architecture #631Z or stock market forecast charts by artist Stephen F. Condren.

Image Location

Prints, StockMarket, Dome Architecture, Date

Credits

The charts that are used are from StockCharts.com, with many thanks.

Stephen F. Condren ~ Artist

Related Links

Stock Market Architecture #629Z

Posted on

Stock Market Architecture #629Z

Stock market architecture #629Z or stock market forecast charts by artist Stephen F. Condren.

Stock market architecture #629Z or stock market forecast charts, pencil rendering by artist Stephen F. Condren, of Condren Galleries, with prints, and scans predicting future stock market moves. Prints & Scans Of This Drawing #629Z ~ Order Here.

Posted on Google+, Facebook, Twitter, Linked-in, and Tumblr.

Stock Market Architecture

Stock Market Analysis

As you can see from my drawing above, there are cores at the center of every dome, because like the human body, the core is the focal point of movement. I have sketched just a few of the countless cores that are in the stock market, because this gives you an idea of how the structure of the stock market is linked together. Everything about the stock market is geometric.

Pencil Rendering

In my renderings below you can see the composition of the FOMC bubble, because this is an incongruent element to the stock market. This FOMC bubble is now finished and will be wiped out along with a vast series of local domes, as the stock market heads down to the 22,000 level.

Stock market architecture #629Z or stock market forecast charts by artist Stephen F. Condren.
Stock market forecast chart pencil drawing by artist Stephen F. Condren.
Stock market architecture #629Z or stock market forecast charts by artist Stephen F. Condren.
Stock market forecast chart pencil drawing by artist Stephen F. Condren.
Stock market architecture #629Z or stock market forecast charts by artist Stephen F. Condren.
Stock market forecast chart pencil drawing by artist Stephen F. Condren.

Meta Description

Stock market architecture #629Z or stock market forecast charts, pencil rendering by artist Stephen F. Condren with prints & scans predicting future moves.

Alt Image Tag

Stock market architecture #629Z or stock market forecast charts by artist Stephen F. Condren.

Image Location

Prints, StockMarket, Dome Architecture, Date

Credits

The charts that are used are from StockCharts.com, with many thanks.

Stephen F. Condren ~ Artist

Related Links

Stock Market Architecture #627Z

Posted on

Stock Market Architecture #627Z

Stock market architecture #627Z or stock market forecast charts by artist Stephen F. Condren.

Stock market architecture #627Z or stock market forecast charts, pencil rendering by artist Stephen F. Condren, of Condren Galleries, with prints, and scans predicting future stock market moves. Prints & Scans Of This Drawing #627Z ~ Order Here.

Posted on Google+, Facebook, Twitter, Linked-in, and Tumblr.

Stock Market Architecture

Stock Market Analysis

As you can see from my drawing above, the stock market has finished detailing the FOMC announcement of two weeks ago, and now will commence a rapid decline to the 22,000 level. The stock market has been on a decline for the past year, but the infestation of bubbles has been a masquerade to this.

Pencil Renderings

The pencil rendering above shows the rally caused by the FOMC announcement on December 11th, because the bubbles are now very large.

Meta Description

Stock market architecture #627Z or stock market forecast charts, pencil rendering by artist Stephen F. Condren with prints & scans predicting future moves.

Alt Image Tag

Stock market architecture #627Z or stock market forecast charts by artist Stephen F. Condren.

Image Location

Prints, StockMarket, Dome Architecture, Christmas, 2019

Merry Christmas!

Credits

The charts that are used are from StockCharts.com, with many thanks.

Stephen F. Condren ~ Artist

Related Links

Stock Market Architecture #626Z

Posted on

Stock Market Architecture #626Z

Stock market architecture #626Z or stock market forecast charts by artist Stephen F. Condren.

Stock market architecture #626Z or stock market forecast charts, pencil rendering by artist Stephen F. Condren, of Condren Galleries, with prints, and scans predicting future stock market moves. Prints & Scans Of This Drawing #626Z ~ Order Here.

Posted on Google+, Facebook, Twitter, Linked-in, and Tumblr.

Stock Market Architecture

Stock Market Analysis

The drawing above shows that we are near the end of the FOMC rally, and now the stock market will head down to the 22,000 level.

Pencil Rendering

The pencil rendering above shows that the stock market is built upon a series of bubbles, or domes, that hold up the graphics. This is the science used by nature to make things work. You will also note the ray that aligns the bubbles from the bottom left to the top right, because rays are the force that align the bubbles into their appropriate position.

Meta Description

Stock market architecture #626Z or stock market forecast charts, pencil rendering by artist Stephen F. Condren with prints & scans predicting future moves.

Alt Image Tag

Stock market architecture #626Z or stock market forecast charts by artist Stephen F. Condren.

Image Location

Prints, StockMarket, Dome Architecture, Date

Credits

The charts that are used are from StockCharts.com, with many thanks.

Stephen F. Condren ~ Artist

Related Links

Stock Market Architecture #623Z

Posted on

Stock Market Architecture #623Z

Stock market architecture #623Z or stock market forecast charts by artist Stephen F. Condren.

Stock market architecture #623Z or stock market forecast charts, pencil rendering by artist Stephen F. Condren, of Condren Galleries, with prints, and scans predicting future stock market moves. Prints & Scans Of This Drawing #623Z ~ Order Here.

Posted on Google+, Facebook, Twitter, Linked-in, and Tumblr.

Stock Market Architecture

Stock Market Analysis

As you can see from my drawing above the rays are the key to understanding Dome Architecture, because the stock market is based on the alignment of these rays. Everything in the market is organic, because it is natural. Like gravity, and sound waves, the movement of the stock market works in tandem with the elements of nature.

Pencil Rendering

If you look closely at my rendering you can see the footers of the rays that denote the curve of the dome that the last year of the stock market rests on. This is a mathematically proven fact, and not my opinion.

Stock market forecast chart pencil drawing by artist Stephen F. Condren.
Stock market architecture #623Z or stock market forecast charts by artist Stephen F. Condren.
Stock market forecast chart pencil drawing by artist Stephen F. Condren.
Stock market architecture #623Z or stock market forecast charts by artist Stephen F. Condren.
Stock market forecast chart pencil drawing by artist Stephen F. Condren.
Stock market architecture #623Z or stock market forecast charts by artist Stephen F. Condren.
Stock market forecast chart pencil drawing by artist Stephen F. Condren.

Meta Description

Stock market architecture #623Z or stock market forecast charts, pencil rendering by artist Stephen F. Condren with prints & scans predicting future moves.

Alt Image Tag

Stock market architecture #623Z or stock market forecast charts by artist Stephen F. Condren.

Image Location

Prints, StockMarket, Dome Architecture, 12/20/2019

Credits

The charts that are used are from StockCharts.com, with many thanks.

Stephen F. Condren ~ Artist

Related Links

Stock Market Architecture #622Z

Posted on

Stock Market Architecture #622Z

Stock market architecture #622Z or stock market forecast charts by artist Stephen F. Condren.

Stock market architecture #622Z or stock market forecast charts, pencil rendering by artist Stephen F. Condren, of Condren Galleries, with prints, and scans predicting future stock market moves. Prints & Scans Of This Drawing #622Z ~ Order Here.

Posted on Google+, Facebook, Twitter, Linked-in, and Tumblr.

Stock Market Architecture

Stock Market Analysis

As you can see from my drawing above the market has capped out from the FOMC announcement of last Wednesday, because the dome has reached it’s apex. You can clearly see this by the large bulbinated dome on the right-hand side of the schematic. The stock market is now ready to finish this region, and move down to the next lower echelon.

Pencil Rendering

The rendering above shows the footers that delineate the curve of the domes, because the rays navigate you to this curve. The alignment of the footers are the key to understanding the curves, which is the foundation of Dome Architecture.

Meta Description

Stock market architecture #622Z or stock market forecast charts, pencil rendering by artist Stephen F. Condren with prints & scans predicting future moves.

Alt Image Tag

Stock market architecture #622Z or stock market forecast charts by artist Stephen F. Condren.

Image Location

Prints, StockMarket, Dome Architecture, 12/18/2019.

Credits

The charts that are used are from StockCharts.com, with many thanks.

Stephen F. Condren ~ Artist

Related Links

Stock Market Architecture #621Z