
Stock market architecture #622Z or stock market forecast charts, pencil rendering by artist Stephen F. Condren, of Condren Galleries, with prints, and scans predicting future stock market moves. Prints & Scans Of This Drawing #622Z ~ Order Here.
Posted on Google+, Facebook, Twitter, Linked-in, and Tumblr.
Stock Market Architecture
Stock Market Analysis
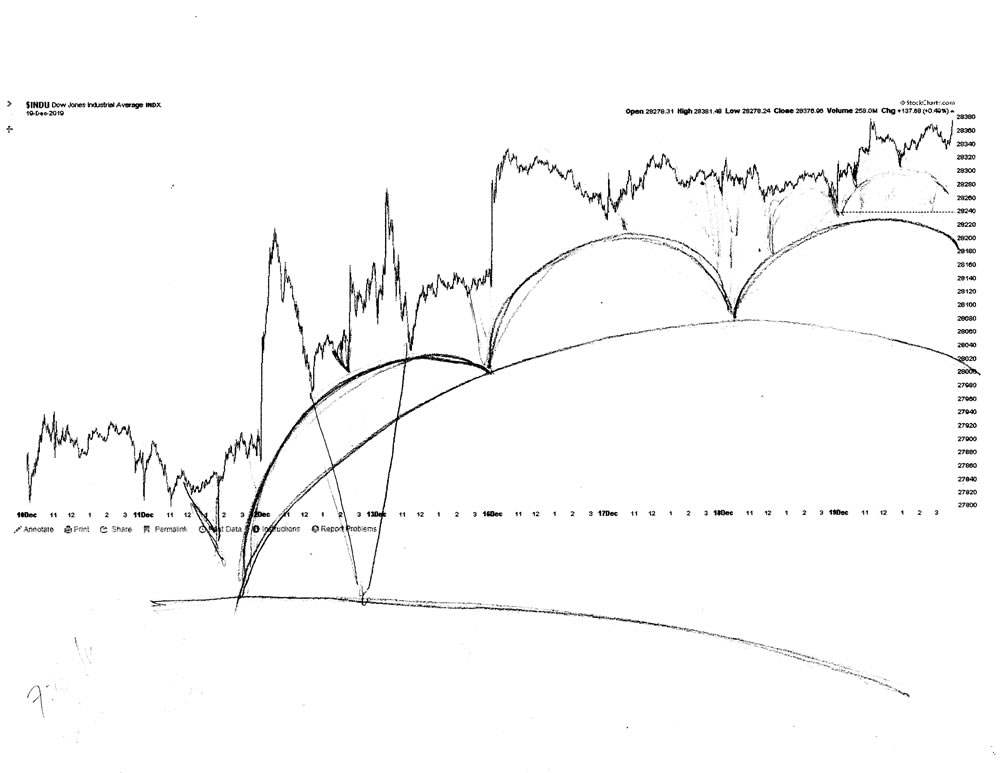
As you can see from my drawing above the market has capped out from the FOMC announcement of last Wednesday, because the dome has reached it’s apex. You can clearly see this by the large bulbinated dome on the right-hand side of the schematic. The stock market is now ready to finish this region, and move down to the next lower echelon.
Pencil Rendering
The rendering above shows the footers that delineate the curve of the domes, because the rays navigate you to this curve. The alignment of the footers are the key to understanding the curves, which is the foundation of Dome Architecture.
Meta Description
Stock market architecture #622Z or stock market forecast charts, pencil rendering by artist Stephen F. Condren with prints & scans predicting future moves.
Alt Image Tag
Stock market architecture #622Z or stock market forecast charts by artist Stephen F. Condren.
Image Location
Prints, StockMarket, Dome Architecture, 12/18/2019.
Credits
The charts that are used are from StockCharts.com, with many thanks.
Stephen F. Condren ~ Artist
Related Links
Stock Market Architecture #621Z