
Stock market forecast #661Z or stock market architecture charts, pencil rendering by artist Stephen F. Condren, of Condren Galleries, with prints, and scans predicting future stock market moves. Prints & Scans Of This Drawing #661Z ~ Order Here.
Posted on Google+, Facebook, Twitter, Linked-in, and Tumblr.
Stock Market Architecture
Stock Market Analysis
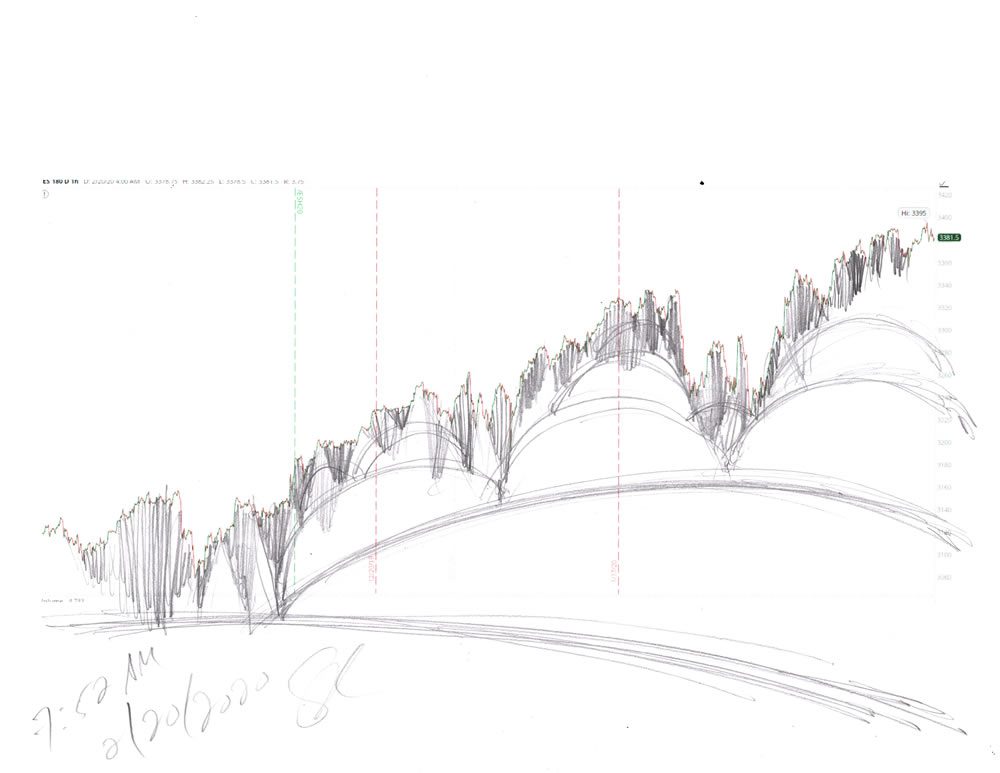
From my chart above, you can see that we have past the half way point in the FOMC Bubble and are now headed down to the 22,000 level, because the dome is now ending. As you can see the current dome that we are on is the same as the coiled head of a rattle snake waiting to strike, because this is organic, and how Nature works. In the same manner as a surfer on a tidal wave, the peak is just before the crash on the sea shore.
Pencil Rendering
If you look carefully you can see the series of smaller domes that rest upon the larger ones, because this is organic.
Meta Description
Stock market forecast #661Z or stock market architecture charts, pencil rendering by artist Stephen F. Condren with prints & scans predicting future moves.
Alt Image Tag
Stock market forecast #661Z charts by artist Stephen F. Condren.