
Stock market architecture #613Z or stock market forecast charts, pencil rendering by artist Stephen F. Condren, of Condren Galleries, with prints, and scans predicting future stock market moves. Prints & Scans Of This Drawing #613Z ~ Order Here.
Posted on Google+, Facebook, Twitter, Linked-in, and Tumblr.
Stock Market Architecture
Stock Market Analysis
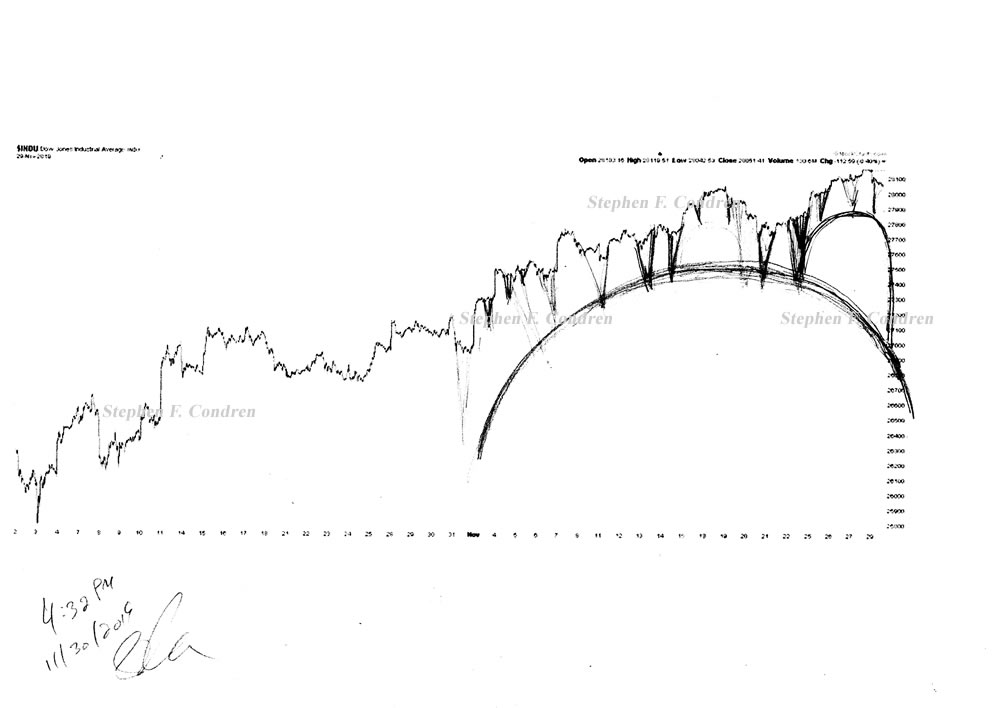
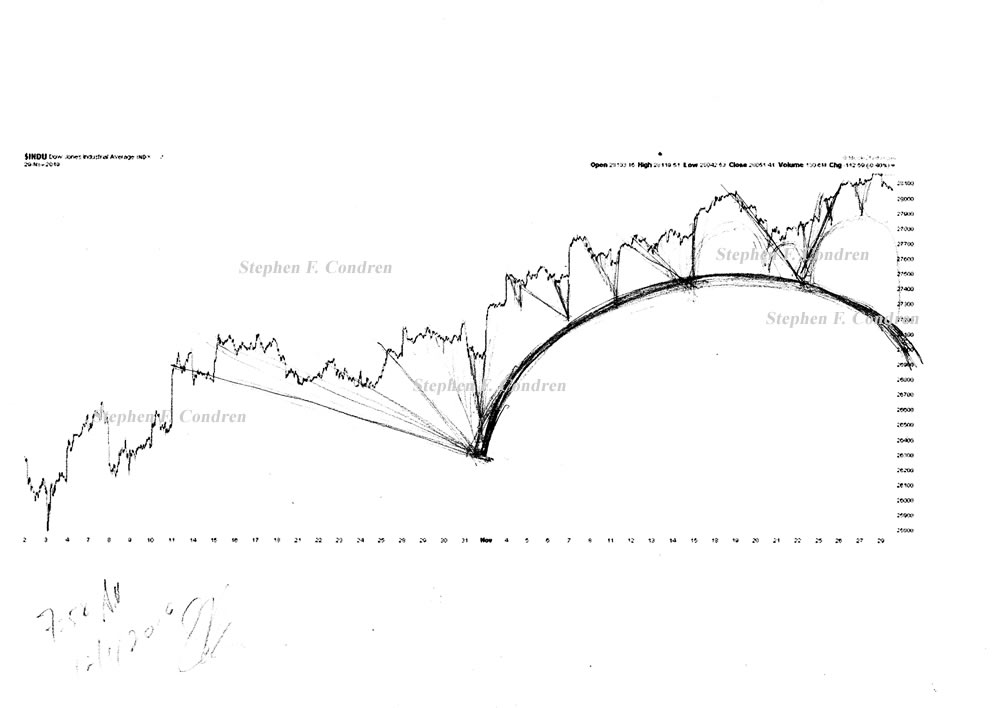
From my chart that you can see above it shows that the market has reached it’s peak, and is now headed down, because the bubbles are now going down. I cannot always know how far down the market with drop, because I do not know the distance of the other bubbles.
Pencil Rendering
The architecture of the market is shown to have a long and hard rally to this current height, and now is taking a breather. It is always easier to see where the market is going to drop, because you have many bubbles the to get architectural data from. However, when the market starts out on a rally it is difficult to know how high it will go, as in the case of the market rally with the election of Donald Trump as President.
Meta Description
Stock market architecture #613Z or stock market forecast charts, pencil rendering by artist Stephen F. Condren with prints & scans predicting future moves.
Alt Image Tag
Stock market architecture #613Z or stock market forecast charts by artist Stephen F. Condren.
Image Location
Prints, StockMarket, Dome Architecture, 11/29/2019
Credits
The charts that are used are from StockCharts.com, with may thanks.
Stephen F. Condren ~ Artist
Related Links
Stock Market Architecture #611Z