Logan Paul 724Z vs Floyd Mayweather pen & ink celebrity drawing by Stephen Condren.
To Order ~ Pick Here
Logan Paul 724Z
Celebrity
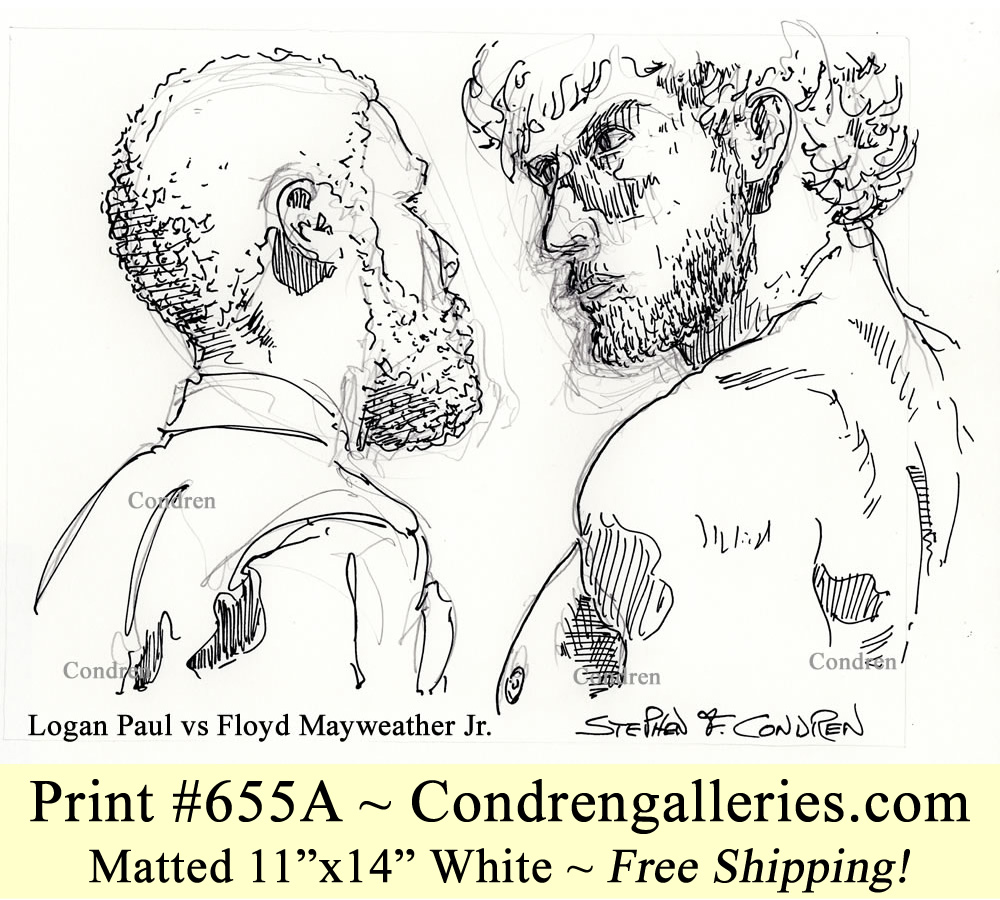
This fine pen & ink drawing of Logan Paul and Floyd Mayweather shows the two men heated up and face to face for the boxing match that is to come. This is one of the most highly anticipated events to come along for both celebrities in a long time. It was interesting to see how it all built up before the boxing match.
Logan Paul is a boxer, but a difficult match for the world champion, Floyd Mayweather. Further, Logan Paul is not in shape as he would be had he been actively in the boxing ring. Logan Paul is a fit and good looking man, no doubt, but hot as fit at these full-time boxers are.
Celebrity
Image
The drawing lends itself nicely to a black pen & ink rendering because of the high contrast shade and shadows on the face of Logan Paul, and back of Floyd Mayweather.
Drawings
Rendering
This drawing is a study in high contrast imagery with an emphasis on contour lines. If you look closely and the face of Logan Paul, you can see the I have used hatched lines to make the shade and shadows under his eyes and on his nose. Hatching is the best way to capture shading with pen & ink drawings.
The Model ~ Giving Full Credit
Logan Paul 724Z
Instagram, Twitter, Facebook
The model(s) for this fictional rendering has no association with the drawing, because it is not about the model, further, the model’s sexual preferences are not known or suggested in this post.