Posted on

Stock Market Forecast #664Z

Stock market forecast #664Z charts by artist Stephen F. Condren.

Stock market forecast #664Z or stock market architecture charts, pencil rendering by artist Stephen F. Condren, of Condren Galleries, with prints, and scans predicting future stock market moves. Prints & Scans Of This Drawing #664Z ~ Order Here.

Posted on Google+, Facebook, Twitter, Linked-in, and Tumblr.

Stock Market Architecture

Stock Market Analysis

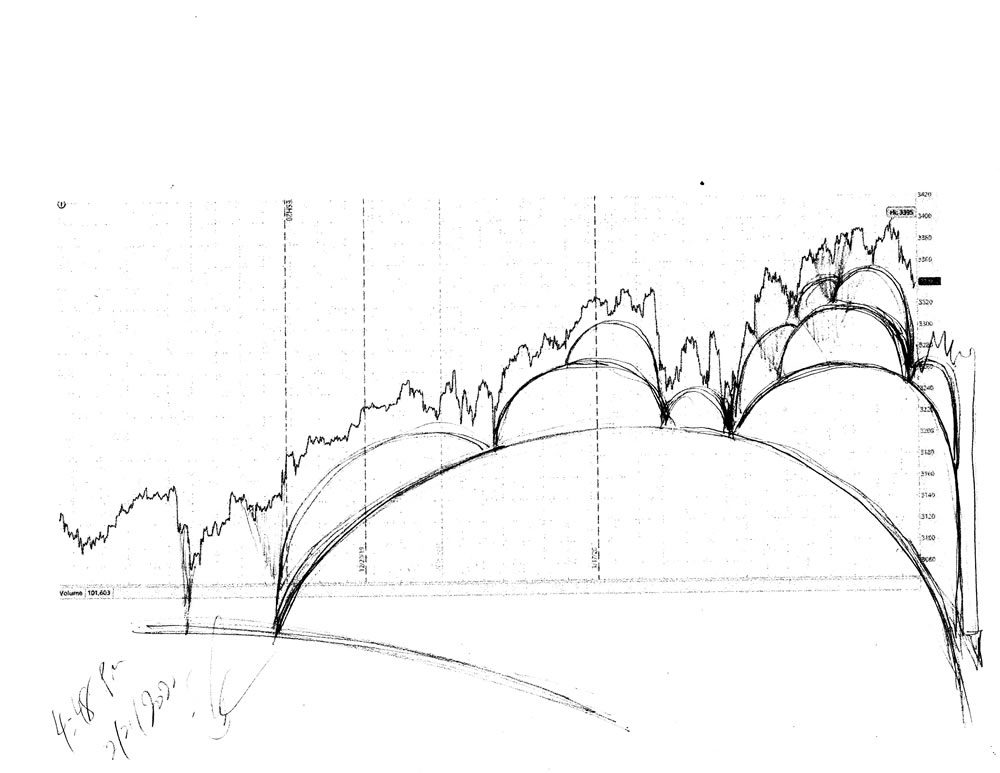
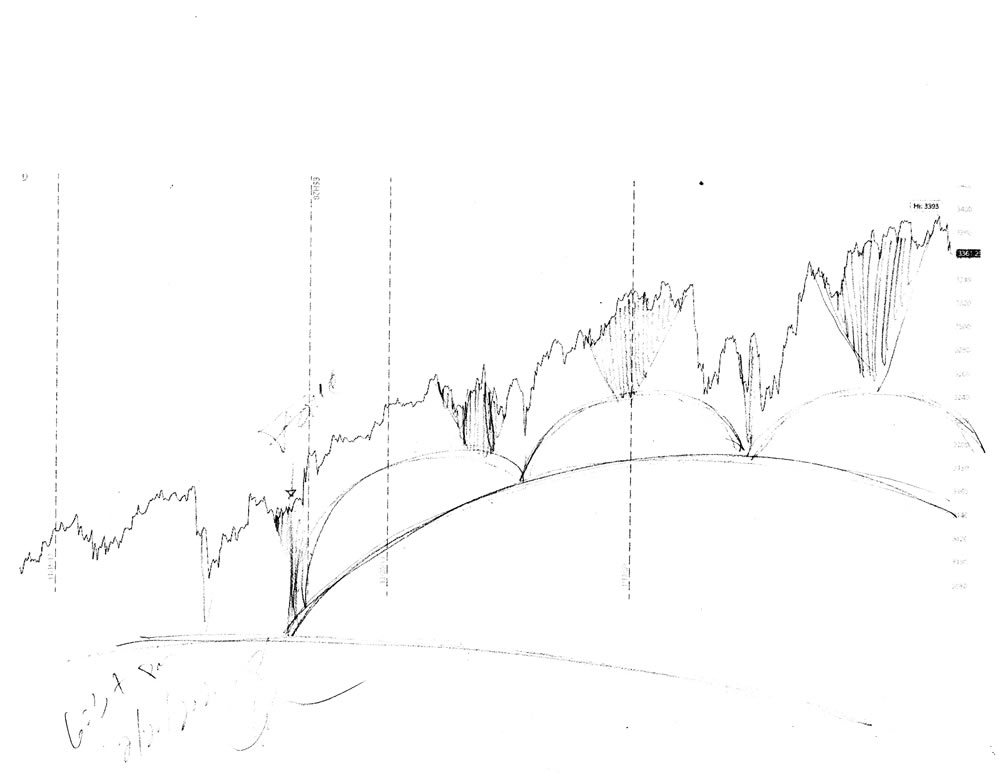
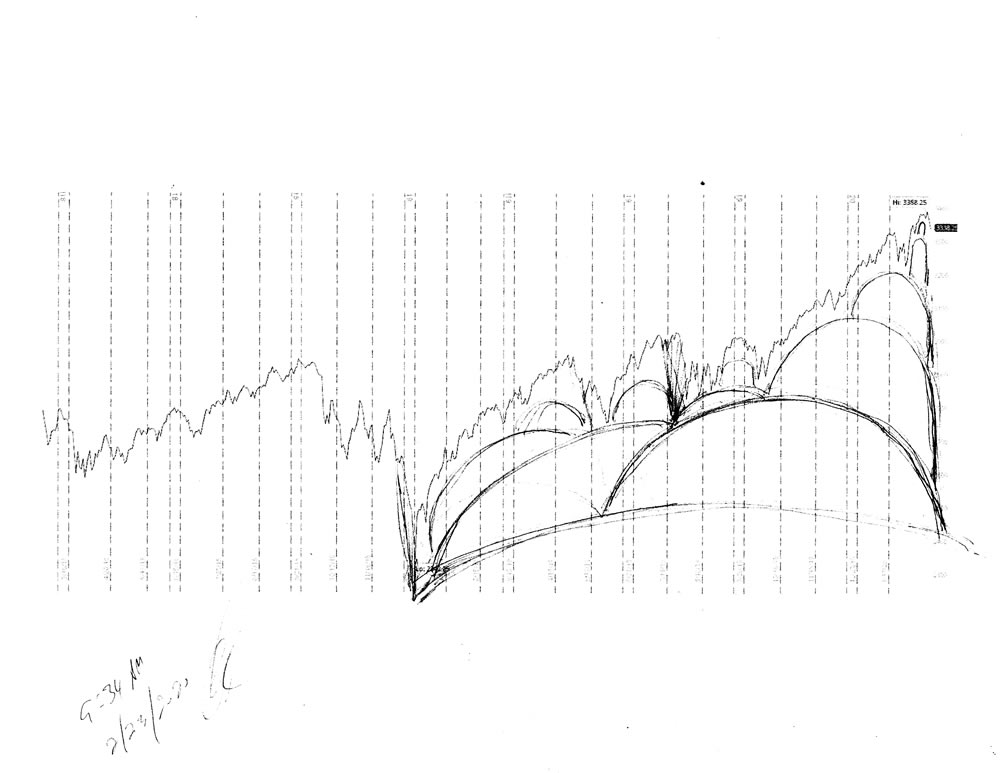
As you can see from my chart above for a period of over a year, the stock market has reached it’s peak, because it is at the top of a series of domes that make this very high point. It must be understood that since we are dealing with Science, and the laws of Physics, because everything about the stock market movement is organic, all the domes must be seen.

Domes

In other words, each and every bubble that is made had to be seen to completion. So in the case before us every dome that has been created up to this very high point has to be exposed on the down side, to show that it was a dome. All domes made must be seen.
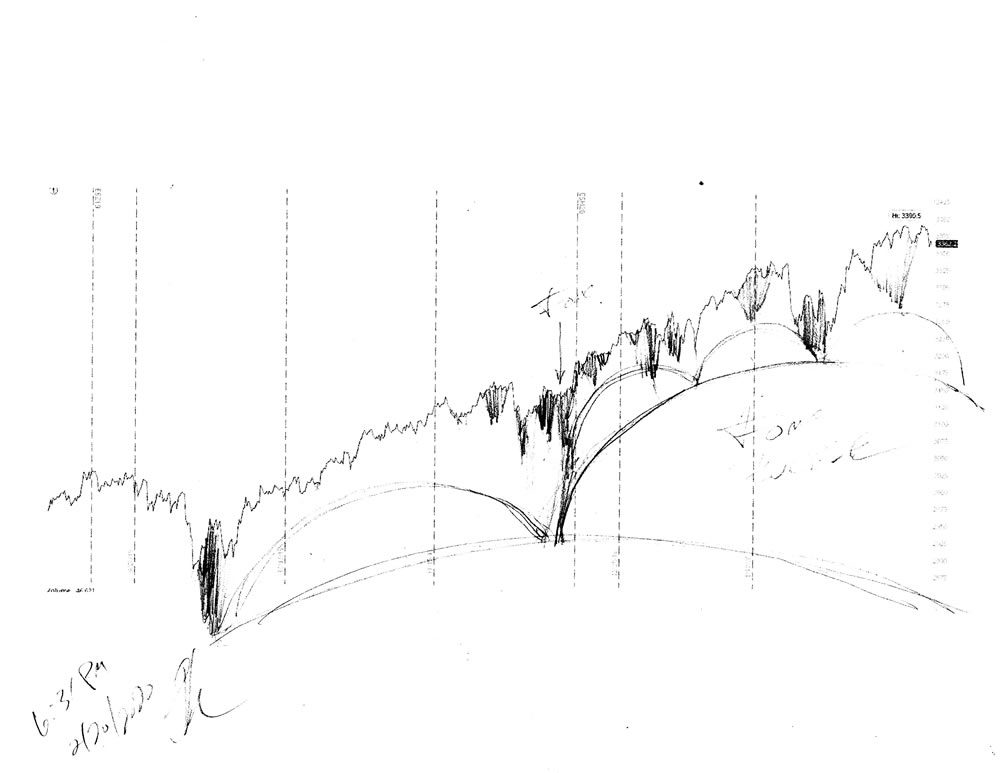
FOMC

The market is now nearing the end of processing out the FOMC bubble created last December, because it does not belong here, it is just on over-sized wart that needs to be removed.

Pencil Rendering

If you look carefully at the rendering you can see all of the footers that make the domes, that the stock market climes to attain it’s height. Now that we are on the decline the images of the domes will be similar to slinkies going down stairs. This is because it is all about physics, and organic natural activity in the processing of material. Since stock market analysists are not artist or physicists they are not able to understand this. They only think in terms of quarterly reports and interest rates. The person to understand the stock market is the artist, because he can see the patterns of the codes, like those of the oak leave, and the movement of the sine waves.

Meta Description

Stock market forecast #664Z or stock market architecture charts, pencil rendering by artist Stephen F. Condren with prints & scans predicting future moves.

Alt Image Tag

Stock market forecast #664Z charts by artist Stephen F. Condren.

Image Location

Prints, StockMarket, Dome Architecture, 2/21/2020

Credits

The charts that are used are from Charles Schwab, with many thanks.

Stephen F. Condren ~ Artist

Related Links

Stock Market Forecast #663Z

Posted on

Stock Market Forecast #663Z

Stock market forecast #663Z charts by artist Stephen F. Condren.

Stock market forecast #663Z or stock market architecture charts, pencil rendering by artist Stephen F. Condren, of Condren Galleries, with prints, and scans predicting future stock market moves. Prints & Scans Of This Drawing #663Z ~ Order Here.

Posted on Google+, Facebook, Twitter, Linked-in, and Tumblr.

Stock Market Architecture

Stock Market Analysis

In my chart that I have displayed above, you can see my theory for the up and coming decline in the current stock market, because it is based on domes that are completed.

This dome was created by the FOMC last December, and it has taken all of this time to process it out.

Pencil Rendering

When you look at my rendering you will see that it shows the progression of bubbles that from the architecture of the Dow Jones landscape. The market is processing material, and operates like all elements of nature by using sine waves to move the product, be it water, oil, or commodities.

Meta Description

Stock market forecast #663Z or stock market architecture charts, pencil rendering by artist Stephen F. Condren with prints & scans predicting future moves.

Alt Image Tag

Stock market forecast #663Z charts by artist Stephen F. Condren.

Image Location

Prints, Stock Market, 2020, February, 2/21/2020

Credits

The charts that are used are from Charles Schwab, with many thanks.

Stephen F. Condren ~ Artist

Related Links

Posted on

Stock Market Forecast #662Z

Stock market forecast #662Z charts by artist Stephen F. Condren.

Stock market forecast #662Z or stock market architecture charts, pencil rendering by artist Stephen F. Condren, of Condren Galleries, with prints, and scans predicting future stock market moves. Prints & Scans Of This Drawing #662Z ~ Order Here.

Posted on Google+, Facebook, Twitter, Linked-in, and Tumblr.

Stock Market Architecture

Stock Market Analysis

Above is my drawing of the current region of the stock market for the last few months, because this is the most important sector that we need to be concerned with. This is the road that we are currently on, and we need to know our map and GPS.

Pencil Rendering

Below is my drawing of the last 180 days which shows a larger view of the current market, because it puts things into perspective. As you can clearly see from my renderings we are now leaving the very top of the market and headed down to the 22,000 level.

Stock market forecast #662Z charts by artist Stephen F. Condren.
Stock market forecast chart pencil drawing by artist Stephen F. Condren.

Meta Description

Stock market forecast #662Z or stock market architecture charts, pencil rendering by artist Stephen F. Condren with prints & scans predicting future moves.

Alt Image Tag

Stock market forecast #662Z charts by artist Stephen F. Condren.

Image Location

Prints, StockMarket, Dome Architecture, Date

Credits

The charts that are used are from Charles Schwab, with many thanks.

Stephen F. Condren ~ Artist

Related Links

Stock Market Forecast #661Z